Editorial
Rising Energy Costs to Offset Trend in Deflation?
|
|
 Following eleven successive increases in the 10-year benchmark interest rate the FOMC engineered a reduction in U.S. inflation as measured by the Consumer Price Index (CPI) from 8.9 percent in June 2022 to 3.5 percent in March 2024. The increase in the benchmark interest rate did not result in unemployment and many influential economists predict a “soft landing”. Following eleven successive increases in the 10-year benchmark interest rate the FOMC engineered a reduction in U.S. inflation as measured by the Consumer Price Index (CPI) from 8.9 percent in June 2022 to 3.5 percent in March 2024. The increase in the benchmark interest rate did not result in unemployment and many influential economists predict a “soft landing”.
Despite the substantial increase in the inflation rate, attaining an elusive FOMC inflation target of approximately 2.0 percent will be difficult to accomplish. At the beginning of year, the market anticipated as many as six reductions in interest rates. The five consecutive pauses suggested caution and based on CPI, wage and employment data there will probably be only one or two reductions of 0.25 percent each in 2024 and not before late summer. Federal Reserve Chairman Powell, supported by Federal Reserve Governors, has stated in Congressional testimony and in public statements that decisions on reducing interest rates would be based on data with demonstrable progress in reducing inflation.
Energy is a major contributor to “sticky” inflation having increased by close to 25 percent since December 2023. Although turbulence in the Middle East could have been a significant factor in the increase, effectively disciplined restriction in output by OPEC+ has maintained price above $80 per barrel. As noted in successive weekly Economy, Energy and Commodity Reports in EGG-NEWS, the November reduction in OPEC+ output of 2.2 million barrels a day was extended through June representing two percent of global production. Non-OPEC output including Brazil, Angola and the U.S. has in large measure moderated the effect of the OPEC+ constraints. OPEC+ has learned that high oil prices reduce demand, and the Cartel has acquired the skill and discipline to fine-tune supply to regulate price and to disfavor alternative sources of energy.
Restoration of the economies of the E.U. and China, concurrent with increased industrial activity, will however create further demand for crude and other forms of non-renewable energy with valid predictions of a rise in price. Despite the reciprocal mutual attacks by Israel and Iran during the current month, the Brent Crude benchmark is still below $90 per barrel compared to a high of $95 in August 2023 and a recent low of $75 per barrel during November 2023. Economists predict that if OPEC cuts hold, Brent Crude could reach $100 per barrel by mid-summer attributed to increased demand.

Unknowns relating to future oil supply and prices will be influenced by possible reaction by Iran. Obviously increased sanctions against the regime will evoke a response either by the rulers of that nation or their surrogates. Interdicting transport of crude through the straits of Hormuz or additional action by Houthi rebels in the Bab-el-Mandeb strait could drive oil above $100 per barrel. This would result in international action including pressure by China, the major purchaser of Iranian oil. Given recent history, it is anticipated that Brent Crude will fluctuate between $85 and $90 per barrel though summer. Availability of domestic supply in the U.S. will probably constrain WTI crude at between $82 and $87 per barrel but higher prices will favor increased exports.
Since the price of oil is closely correlated with corn and other agricultural commodities, any escalation in price has implications for livestock production. Higher prices for diesel and gasoline will limit consumer spending with a negative effect on the earnings of food producers, distributors and retailers. According to the American Automobile Association
U.S. consumers paid on average, $3.66 per gallon for regular grade during mid-April.
It is axiomatic that the pump price of gasoline will influence the November election with high prices attributed to the incumbent party, irrespective of justification.

|
Egg Industry News
Egg Week
|
|
 USDA Weekly Egg Price and Inventory Report, April 24th 2024. USDA Weekly Egg Price and Inventory Report, April 24th 2024.
Market Overview
- The average wholesale unit revenue values for Midwest Extra-large, Large and Medium sizes were unchanged this past week. Wholesale price for Midwest in cartons at $2.50 per dozen was approximately $0.90 per dozen above the 3-year average of $1.60 per dozen and up $0.80 from the corresponding week in 2023 at $1.70 per dozen. This past week shell egg inventory was up by 1.5 percent, reversing a fall of 1.4 percent the previous week.
- Although there has been a weekly increase in pullet flocks transferred to laying houses, hen numbers are constrained by the loss of close to 13 million hens due to HPAI on twelve complexes holding from 250,000 to 2.6 million hens during the 4th Quarter of 2023. Pullets are in short supply with losses of 2.5 million growing birds, mainly in California. Since the beginning of April close to 8.4 million hens collectively have been depopulated in a sequence comprising one complex in Texas and three related facilities under common ownership in Michigan in addition to a breeder complex in New Mexico.
- This past week chains apparently narrowed the spread between delivered cost and shelf price. This could result in a continued reduction in generic stock with a proportional rise in demand but only with constant re-ordering to fill the pipeline into May. Discounters are holding prices on generics influencing mainstream retail stores. Eggs are still highly competitive in price against the comparable costs for other protein foods.
- Total industry inventory was up by 1.3 percent overall this past week to 1.64 million cases with a concurrent 0.2 percent increase in breaking stock, following a 1.9 percent increase during the preceding processing week. Demand for egg products continues into May despite less home baking and entertaining. Egg products are required for the food service and manufacturing sectors and for exports that increased in February.
- It is now apparent that the inventory held by chains and other significant distributors may be more important over the short term in establishing wholesale price compared to the USDA regional inventory figures. Changes in stock held by DCs and in the pipeline as determined by weekly orders are probably responsible for small cyclic fluctuation in weekly industry stock, especially into and after a holiday weekend.
- Cases of HPAI in the commercial poultry industry and backyard (non-commercial WOAH) flocks tapered during the first quarter of 2024, coincident with the end of the Fall migration of waterfowl that was extended in late 2023 by mild weather. The emergence of the infection in a large complex with 2 million birds in western Texas suggested a reoccurrence of the epornitic as northward spring migration has commenced. The three subsequent related cases in Michigan involving a total of 6.4 million hens may have commenced as an indirect extension from an infected dairy herd although an epidemiologic evaluation in progress will be required to confirm the source and routes of intra-Company dissemination. The number and extent of future possible outbreaks during the spring and fall months of 2024 cannot be projected but sporadic cases in backyard poultry and 32 dairy herds in eight widely diverse states is a cause for concern. More surveillance information should be released by USDA-APHIS as it becomes available concerning the prevalence rate of carriers among resident domestic free-living birds and a review of molecular and field epidemiology for the 2022 spring and fall waves of HPAI. The USDA has yet to identify and release specific modes of transmission for the 2022-2023 epornitic including likely airborne spread from wild birds and their excreta over short distances.
- The current relationship between producers and chain buyers based on a single commercial price discovery system constitutes an impediment to a free market. The benchmark price appears to amplify both downward and upward swings as evidenced over the past two years. A CME quotation based on Midwest Large, reflecting demand relative to supply would be more equitable. If feed cost is determined by CME ingredient prices then generic shell eggs should be subject to a Midwest Large quotation.
- According to the USDA the U.S. flock in production was apparently up by 0.9 million hens (0.3 percent) to a new level of 307.0 million for the week ending April 24th The stated total flock of 312.3 million included about one million molted hens that will resume lay during coming weeks plus 4.5 million pullets scheduled to attain production. Given the latest figures it is estimated that the producing flock is at least 17 to 20 million hens lower than before the onset of HPAI in 2022. In January 2024 the USDA adjusted figures to account for depopulation of 13 million hens spread over the last quarter of 2023. There were evident discrepancies between published figures and the theoretical number of hens over successive weeks taking into account known losses and predetermined pullet replacements. The April loss of 8.4 million hens is not reflected in data released over the past three weeks. It is hoped that the USDA Agency responsible for publication of flock size will get their act together and coordinate with APHIS to record the number of depleted flocks and promptly provide accurate data. Figures released on April 24th have overestimated flock size
- The ex-farm price for breaking stock (rounded to one cent) was unchanged at $1.58 per dozen.Checks delivered to Midwest plants were up 0.7 percent to $1.43 per dozen this past week. Prices for breaking stock should follow the wholesale price for shell eggs usually with a lag of about one to two weeks.
The Week in Review
Prices
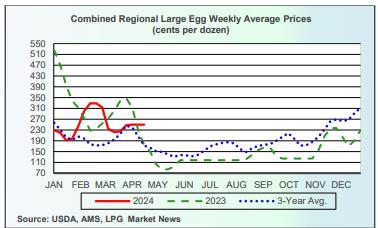
According to the USDA Egg Market News Reports released on April 22nd 2024, the Midwest wholesale price (rounded to one cent) for Extra-large was unchanged from last week at $2.43 per dozen. Large was unchanged at $2.41 cents per dozen. Mediums were unchanged at $2.30 per dozen delivered to DCs. Prices should be compared to the USDA benchmark average 4-Region blended nest-run cost of 75.3 cents per dozen as determined by the Egg Industry Center based on USDA data for March 2024. This value excludes provisions for packing, packaging materials and transport, amounting to 57 cents per dozen as determined in mid-2023 from an EIC survey (with low response) and now realistically 60 cents per dozen.
Currently producers of generic shell eggs should be operating with positive margins irrespective of region and customer-supply agreements. The progression of prices during 2023 and 2024 to date is depicted in the USDA chart reflecting three years of data, updated weekly.

|
Egg Projection
|
|
Updated April 2024 USDA Projection for U.S. Egg Production and Consumption.
 On April 17th 2024 the USDA Economic Research Service (ERS) issued confirmed values for egg production during 2022 with a projection for 2023 and a forecast for 2024. Production, consumption and prices were only slightly revised from the previous March 14th 2024 report. On April 17th 2024 the USDA Economic Research Service (ERS) issued confirmed values for egg production during 2022 with a projection for 2023 and a forecast for 2024. Production, consumption and prices were only slightly revised from the previous March 14th 2024 report.
Projected egg production for 2023 was unchanged from the March 2024 Report at 7,864 million dozen This will be 0.5 percent higher than in 2022 due to progressive replacement of the 44 million hens depleted due to HPAI over the period extending from early spring through mid-December 2022. The per capita consumption of shell eggs and liquids combined for 2023 was unchanged from the March report at 279.3 eggs but down 1.2 eggs (0.4 percent) from 2022. The projected average 2023 benchmark New York bulk unit price was unchanged from the March report at 192 cents per dozen. This was 31.8 percent lower than in 2022 attributed to a comparison with unseasonal high prices from the end of March through the 2nd Quarter of 2023.
Subsequent USDA projections will provide greater clarity on the recovery in consumption in an economy that is undergoing deflation. The 2023 Midwest in-carton national wholesale price peaked at $5.17 per dozen on January 3rd 2023 but fell precipitously to a market bottom of $0.78 per dozen on May 8th 2023. Price was restored during February 2024 and settled at $2.50 per dozen on April 12th 2024, higher than for the post-Easter period. This was above the USDA/EIC projection of the combined nest-run March 2024 cost of 75.3 cents per dozen for caged white Large, plus a provision for processing, packaging and transport of 60 cents per dozen amounting to $1.35 cents per dozen delivered to a distribution center.
Restoration in flock size after HPAI flock depletions in 2022 progressed at a rate of approximately 0.5 million per week but placements were limited by the availability of pullet chicks and in some companies the rate of conversion to alternative housing systems. Restoration of the national flock was compromised by a resurgence of HPAI with 13.0 million layers depleted during the 4th quarter of 2023 representing 4.0 percent of the nominal producing flock of 325 million hens, mainly on complexes averaging over one million hens. The cost of ingredients will influence margins and may result in cessation of production by some small-scale producers that run out of working capital since financial losses were incurred through summer up to mid-fall. Unpredictable factors affecting price will include the extent of losses during the spring of 2024 due to a predicted reemergence of avian influenza. Approximately 8.5 million hens have already been lost to HPAI during April to date involving mainly four large complexes. Exports of eggs and products at approximately two percent of total production will not materially affect the domestic price.
 The lagging forecast for 2024 includes production of 7,920 million dozen, up 0.7 percent from 2023. Consumption will attain 280.6 per capita, up a more realistic 1.3 eggs or 0.5 percent above the projection for 2023. USDA project a NY-Large price of $2.03 per dozen up 5.7 percent from the average for 2023. The lagging forecast for 2024 includes production of 7,920 million dozen, up 0.7 percent from 2023. Consumption will attain 280.6 per capita, up a more realistic 1.3 eggs or 0.5 percent above the projection for 2023. USDA project a NY-Large price of $2.03 per dozen up 5.7 percent from the average for 2023.
In 2023 egg exports as shell and products combined attained 5,161 million dozen shell-equivalents, or 2.2 percent of production. During 2022 egg imports as a result of HPAI depopulation, some in shell form but predominantly products, attained 25.9 million dozen shell-equivalents, up 42.8 percent from 14.9 million dozen and 26.4 percent from 2021.
During 2023 shell egg exports attained 89.4 million dozen, up 28.6 percent compared to 2022 when high domestic prices prevailed. Egg products were up 18.2 percent to 20,814 metric tons compared to 2022. For the first two months of 2024 shell egg exports were up 8.9 percent in volume to 12.2 million dozen, down 26.7 percent in value to $24.1 million compared to the corresponding months in 2023. Unit value was down 26.9 percent to $1.98 per dozen.
April 2024 USDA data is shown in the table below:-
|
Parameter
|
2020
(actual)
|
2021
(actual)
|
2022
(actual)
HPAI
|
2023
(projection)
|
2024
(forecast)
|
% Difference
2023-2024
|
| |
|
|
|
|
|
|
|
Production (million dozen)
|
8,070
|
8,031
|
7,825
|
7,864
|
7,920
|
+0.7
|
|
Consumption (eggs per capita)
|
279.0
|
282.5
|
280.5
|
279.3
|
280.6
|
+0.5
|
|
New York price c/doz.)
|
112
|
119
|
282
|
192
|
203
|
+5.7
|
Source: Livestock, Dairy and Poultry Outlook released April 17th 2024
Subscribers to EGG-NEWS are referred to the postings depicting weekly prices, volumes and trends and the monthly review of prices, exports and related industry statistics.
|
Commodity Report
|
|
WEEKLY ECONOMY, ENERGY AND COMMODITY REPORT: April 25th 2024.
OVERVIEW
 Prices for corn and soybeans were up by 2.6 and 1.9 percent respectively and soybean meal was higher by 0.9 percent compared to last week. Prices were influenced by technical selling arising from geopolitical concerns and revised projections for crop sizes in Brazil and Argentine. Secondary factors included disruption in shipping in the Red Sea and Panama Canal, carryover from the 2023 U.S. crop, export orders and the predicted ending stocks of corn and soybeans for the 2024 crop. There was no apparent response to release of the April WASDE that retained projections for production and ending stocks from the March report and release of the Planting Intentions Report. Prices for corn and soybeans were up by 2.6 and 1.9 percent respectively and soybean meal was higher by 0.9 percent compared to last week. Prices were influenced by technical selling arising from geopolitical concerns and revised projections for crop sizes in Brazil and Argentine. Secondary factors included disruption in shipping in the Red Sea and Panama Canal, carryover from the 2023 U.S. crop, export orders and the predicted ending stocks of corn and soybeans for the 2024 crop. There was no apparent response to release of the April WASDE that retained projections for production and ending stocks from the March report and release of the Planting Intentions Report.
At noon EDT on April 25th the CME price for corn was up 2.6 percent compared to the previous week to 438 cents per bushel for May delivery. Corn price was influenced by ethanol demand and the proportionally high ending stock of corn from the 2023 crop. Export orders for the current market year have increased in response to lower prices. Volumes and prices are indirectly influenced by higher wheat prices, events in the Black and Red Seas. Orders by China resumed at the end of the 2022-2023 market-year and have extended through March despite a slightly higher Dollar Index offset by a low FOB prices although with increased ocean freight. Total exports for the current market year are 33.5 percent higher than for the corresponding week during the 2022-2023 year.
Soybeans traded at 1,155 cents per bushel for May 2024 delivery, up 1.9 percent over the week. Lower prices were attributed to short covering, farm selling and availability from the 2024 Brazil and Argentine harvests. Total exports for the current market year are 18.1 percent lower than for the corresponding week in the 2022-2023 year.
Soybean meal traded at $341 per ton for May delivery, up 0.9 percent compared to $338 per ton for last week. Price was influenced by demand coupled with high crush volumes for consecutive months from December 2023 onwards with increased capacity. Price will fluctuate to reflect the CME price for soybeans and the demand for biodiesel despite the adverse financial situation in this sector. The market previously responded to the increased 2023 crop and higher stocks together with projections for 2024 unchanged from March in the April WASDE Report.
WTI was $4.91 (-5.6 percent) lower from last week to $82.33 on April 24th with moderate world demand in relation to supply. Price is lower partly due to a lull in the attacks on shipping in the Red Sea, and cessation of hostilities between Israel and Iran. It is accepted that U.S. production is a moderating influence, attaining 12.9 million barrels per day in March with ample reserves. An upward trajectory in price may occur if production cuts by OPEC amounting to 2 million barrels per day and extended through June actually materialize. There was a downward move in price during the week ($85.05 to $81.09 range). Crude oil inventory in the U.S., other than the Strategic Reserve, was down 2.0 percent to 32.4 million barrels last week. High U.S. production is constraining domestic and international prices but the rise in energy cost during past weeks is reflected in inflation restraining the FOMC from lowering the benchmark interest rate.
Economic data released on April 25th (Q1 GDP; PCE, Employment) confirmed slower growth and persistent inflation. A data-driven Federal Reserve FOMC will be disinclined to reduce the benchmark interest rate until the fall at the earliest.
Factors influencing commodity prices in either direction over the past four weeks included:-
- Weather conditions in areas of the World growing corn and oilseeds especially in Brazil and also Argentine with favorable rain recently under the influence of a strong El Nino The 2023 U.S. harvest was completed ahead of the corresponding weeks in 2022 with higher carryover and lower exports of soybeans. (Downward pressure on prices). Planting has commenced for the “new” crop of 2024.
- Geopolitical considerations continue to move markets, especially in the Mideast. Ongoing attacks on Ukraine port facilities have impacted prices of wheat, corn, oilseeds and vegetable oils. Loaded bulk vessels are sailing from Black Sea and Danube River ports using the ‘Humanitarian Corridor” to various destinations. This route is operational despite threats by the Russian Federation to mine the entrance to ports and deployment of airborne missiles. Exports from Ukraine are approaching 1.5 million metric tons per week with a total of 26 million metric tons market year through February, down 11 percent from the equivalent period for 2022-2023 year. Grain production in Ukraine during the current year will be lower than 2022/2023 (Downward pressure on corn and wheat and an indirect effect on soybeans)
- Macroeconomic U.S. factors:-
- Most economists in academia and the private sector are still confident of a “soft landing” for the economy despite the release of the Q1 2024 GDP and recent economic parameters including the CPI and PPI and with fluctuation in bond rates. Annual inflation as measured by CPI declined from 8.9 percent in June 2022 to 3.5 percent in March 2024. This is in part a response to a series of 11 FOMC rate raises that curbed inflation and cooled the labor market but without precipitating unemployment. There is evident stability in the bank sectors in both the U.S. and Europe. Large U.S. banks passed stringent mid-year “stress tests”. There is now concern over regional banks with exposure to commercial real estate. A rise in energy prices is contributing to persistence of inflation.
- The Federal Reserve held the benchmark interest rate steady at the monthly FOMC meeting on March 20th 2024, the fifth sequential pause. The Federal Reserve commentary indicated that the rate would be held at 5.25 percent until a pivot with possibly less than two reductions of 25 basis points each in 2024, after the September meeting at the earliest. Chairman Powell in Congressional testimony and documented in FOMC minutes has indicated that decisions would be based on data and demonstrable progress in reducing inflation towards an annual 2.0 percent target by mid-2025. Market optimism with projections of five reductions during 2024 was evidently premature.
- The March 28th Bureau of Economic Affairs released the advanced estimate of Q1 2024 GDP at 1.6 percent, below the consensus estimate of 2.4 percent. The Q1 GDP value was influenced by spending by both consumer and government-sectors and with higher investment in housing. By comparison Q4 2023 GDP growth was 3.4 percent. Growth in GDP attained 2.5 percent in 2023 up from 1.9 percent in 2022. The Q1 Personal Consumption and Expenditure Index For Q1 (excluding food and energy) was up 3.7 percent annualized, higher than 2.0 percent in Q4 2023.
- On March 29th the Bureau of Economic Analysis released the February Personal Consumption and Expenditure Price Index (excluding food and energy) that was up 0.3 percent from the previous month to 2.8 percent year-over-year. This was in line with estimates. Food prices increased 0.1 percent but energy was up 2.3 percent in March. The Headline PCE Index was up 2.5 percent year-over-year also corresponding to estimates. The price of goods increased 0.1 percent from February and was higher than services at 0.3 percent. Consumer spending was up 0.8 percent, above estimates and compared with 0.2 percent in January, impacted by weather. The headline PCE is closely followed by the Federal Reserve and confirms declining inflation.
- The April 10th Bureau of Labor Statistics release of the March 2024 CPI confirmed a 0.4 percent increase from February, and 0.1 percent above forecast. The annual increase of 3.5 percent was up from 3.2 percent in February and higher than the anticipated value. The increase in the core value (excluding food and energy) was 0.4 percent from February and 3.8 percent for the 12-month period, and estimates. Food at home was unchanged from the previous month. The category of ‘meat, fish and poultry’ was up collectively by 0.9 percent with eggs up 4.6 percent from the previous month. Food away from home was up 0.3 percent from February. On an annual basis all food was up 2.2 percent with food at home up 1.2 percent and food away from home up 4.2 percent. Energy was up 1.1 percent together with natural gas (-3.2 percent) in March. The shelter category was up 0.4 percent for the month and 5.7 percent over the past year. The macro trend is inclining towards reduced inflation due to a fall in energy prices but this category has recently moved up, detracting from deflation. The CPI heavily influences FOMC rate decisions.
- The March Producer Price Index for Final Demand (PPI) released on April 11th was up by 0.2 percent from February compared to an expectation of 0.3 percent. The PPI was up 2.1 percent over the past 12-months. This is compared to a 6.4 percent increase in 2022. The core PPI value excluding volatile fuel and food, was up 0.2 percent for March and up 2.8 percent for the 12-month period. Food was up 0.8 percent compared to a 1.1 percent increase in February.
- A Federal Reserve release on April 16th confirmed that industrial production rose 0.4 percent in March. Capacity utilization was fractionally higher at 78.4 percent, 1.2 percent below the 1972-2020 average.
- The April 24th report on Durable Goods Ordered during March 2024 was higher by 2.6 percent to $283 Billion compared to a revised value of 0.7 percent or $376 Billion in February. Transportation and specifically aircraft orders were up 7.7 percent. Excluding the Transportation component, new orders increased by 0.2 percent in March compared to February. Shipments of durable goods were essentially unchanged from February that in turn was up 1.2 percent from January 2024 impacted by severe weather.
- The April 15th release of retail sales data showed a monthly rise of 0.7 percent in March. This value is compared to the revised 0.9 percent rise in February 2024, reflecting a rebound from depressed sales in January affected by harsh winter storms and a change in the basis of calculation. Retail sales in March 2024 were up 4.0 percent from the corresponding month in 2023. The Federal Reserve FOMC closely monitors retail sales as a measure of the trend in inflation.
- The April 1st release by the Institute for Supply Management (ISM®) documented the Manufacturing Index for March at 50.3 up from 47.8 in February and above the consensus of 48.4. New orders increased to 51.6 (49.2, February) and Production attained 54.6 (48.4, February).
- The April 23rd release of the S&P Global Composite U.S. Manufacturing PMI for April fell to 50.9 compared to revised 52.1 in March. The Global Services PMI fell from 51.7 in March to 51.7 in April.
- The Conference Board Consumer Confidence Index released on March 26th for February/March, rose to 104.7 points. This reading was almost unchanged from a revised 104.8 for the preceding four-week period. The Present Situation Index was up to 157.0 in March from 147.6 in February. The Expectations Index fell to 73.8 in March from 76.3 in February with values below 80.0 suggesting a future recession
- The April 13th University of Michigan Preliminary Index of Consumer Sentiment fell 1.5 points to 77.9 for April down from a revised final value of 79.4 in March. The Index was up from 63.7 in April 2023. Both the Current Economic Index (79.3 down from 82.5 but not statistically significant) and the Index of Consumer Expectations (74.7 down from 77.4 in March) denote a decline in consumer sentiment influenced by stable but high interest rates and inflation despite geopolitical concerns. Inflation expectations 12-months hence moved higher from 2.9 to 3.1 percent among those surveyed.
- Non-farm payrolls added 303,000 for March, as documented by the Bureau of Labor Statistics on April 5th. This was more than the anticipated 214,000, and compares to the revised February value of 270,000. The increase is attributed to workers in the health care and government sectors. The unemployment rate fell to 3.8 percent with 15 million unemployed. Real average weekly earnings for March showed a 0.3 percent increase over February. Average hours worked rose 0.1 percent to 34.4 per week in March. Labor participation increased fractionally from 62.5 percent in February to 62.7 percent in March. Wage rates increased 4.1 percent over 12-months, the lowest gain since June 2021. Wage rates are closely followed by the Federal Reserve FOMC.
- The Bureau of Labor Statistics Job Openings and Labor Survey report released on April 2nd estimated 8.8 million job openings at the end of February, down 100,000 (-0.1 percent) from January 2024 and consistent with estimates. The February job openings number was the lowest value in 34 months and compares with the March 2022 value of 12.2 million during COVID.
- The seasonally adjusted initial jobless claims figure of 207,000 released on April 25th was 5,000 lower than the revised seasonally adjusted value for the week ending April 20th but lower than the Reuter’s estimate of 215,000. The four-week moving average declined to 213,250 The Bureau of Labor Statistics estimated 1.78 million continuing claims for the week ending April 13th down 15,000 from the previous week. There is evidence from data over the past three months that the labor market is cooling despite sporadic weekly fluctuation in new claims.
- The April 5th Bureau of Labor Statistics report recorded a 0.7 percent increase in non-Farm Productivity for 2023. Output increased by 2.6 percent with a 1.9 percent increase in inputs of labor and capital. Hours Worked was up by 1.3 percent in 2023
- The ADP® reported on April 3rd that private payrolls increased by 184,000 in March, up 29,000 from the revised 155,000 in January and compared to the Bloomberg estimate of 150,000 jobs. The increase in employment was mostly in the construction, financial services and manufacturing sectors. Annual pay was up 5.1 percent year-over-year unchanged from February. The increase will not directly influence the probability of short-term future changes in interest rate since the ADP® is regarded by the FOMC as an unreliable statistic
FACTORS INFLUENCING COMMODITY PRICES
- The 2023 harvests of corn and soybeans were completed by late November 2023. The April 11th WASDE projected acreage to be planted, yields, crop size and ending stocks for the 2024 crop.
- It is evident that both polarization in the closely divided chambers of Congress and intra-party conflict between and within both sides of the aisle in the House delayed adoption of appropriations bills. Passage of the 2023 Farm Bill will be contentious and is subject to a 12-month extension as a stop-gap measure. Progress on the 2023 Farm Bill has been impeded by contention over SNAP eligibility and other entitlements that collectively represent 75 percent of total expenditure. The August 2nd downgrade of U.S. debt from AAA to AA+ by Fitch Ratings recognizes Congressional dysfunction. On November 10th 2023 Moody’s downgraded U.S. credibility from ‘stable’ to ‘negative’ based on an inability to pass required fiscal legislation. After four Continuing Resolutions the House and Senate passed six appropriations bills including the FDA and USDA, avoiding a March 8th partial shutdown of the Federal Government. Agreement was concluded on the remaining appropriations bills on March 23rd maintaining Federal funding through October 2024. Currently the Speaker of the House is experiencing difficulty in passing legislation.
- The delayed 2023 Farm Bill is mired in conflict in both the House and Senate. There is no consensus on major issues comprising the magnitude of SNAP payments and eligibility and requested price supports for crops. The Chair of the Senate Agriculture Committee Sen. Debbie Stabenow (D-MI) is standing firm on maintaining both SNAP-WIC benefits and climate remediation funding even if the Farm Bill is delayed through to the 119th Congress
- The April 11th WASDE #647 Projected both corn and soybean production parameters with a potential record corn harvest for the 2024 crop. There will be ample world availability of ingredients although inequitable distribution will result in shortages in some nations. Soybean exports will comprise 38.2 percent of the 2024 U.S. crop with a 7.7 percent increase in ending stock to 340 million bushels as compared to the March WASDE Report.
- Rabobank projected the soybean crop in Brazil at 153 million metric tons on April 4th. This value is higher than the projection by CONAB (the Soy production association in Brazil) at the midpoint of the soybean harvest, of 147 million metric tons (5,401 million bushels) down from a previous estimate of 155 million metric tons (5,695 million bushels). Exports of 100 million metric tons (3,674 million bushels). It is anticipated that Brazil will crush 56 million metric tons (2,057 million bushels). If CONAB is correct the harvest will be 7 million metric tons (269 million bushels) lower than the 2023 record crop. Brazil exported 7.0 million metric tons (257 million bushels) of soybeans to China over the first two months of 2024, double the quantity shipped to this nation over the corresponding two months in 2023.
- Corn production in Brazil for the 2023-2024 market year will attain 124 million metric tons (4,801 million bushels) from all three sequential harvests. But down seven percent from the previous year. Brazil is projected to export of 54 million metric tons (2,125 million bushels). Argentine will produce 50 million metric tons of corn (1,968 million bushels), double compared to the previous year impacted by drought. (Lower prices in the future subject to favorable reports on crop progress and actual harvests)
- The Dollar Index (DXY) was 105.8 at close on April 24th, down 0.1 point from last week responding to CPI data suggesting retention of current benchmark interest rates for a prolonged period. The DXY has ranged from 99.0 to 107.0 over the past 52 weeks. The dollar index influences timing and volume of export orders and indirectly the price of WTI crude.
|
Crop Progress
|
|
Status of the 2024 Corn and Soybean Crops
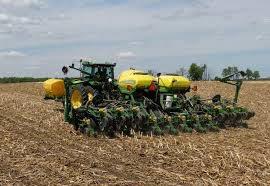
The USDA Crop Progress Report released on April 22nd documented planting for the 2024 soybean and corn season. Farmers are in fields with relatively dry conditions in half of the eight major states producing corn and soybeans allowing rapid seeding of prepared acreage. The “big-eight” (IL, IN, IA, KS, MI, MN, NE and OH) collectively averaged 3.5 days suitable for field work this past week ranging from 2.0 days (OH) to 5.9 days (KS)
Based on the sum of the “adequate” and “surplus” categories, surface and subsoil moisture levels were higher than the corresponding week in 2023. For the past week surface and subsoil moisture values were both 72 percent for the two highest categories of ‘Adequate’ and ‘Surplus’. These levels were higher than the previous year with values of 67 percent for the two highest categories, demonstrating an acceptable pre-planting situation. It is to early in the expected transition to a La Nina event to predict any impact on crop condition in coming weeks. If dry and hot weather in corn and soy areas occurs yield may be depressed depending on timing and severity.
Reference is made to the April 11th WASDE Report #647 under the STATISTICS TAB and the weekly Commodity, Economy and Energy Report in this edition, documenting acreage to be harvested, yields, weekly prices and ending stocks.
| |
WEEK ENDING |
|
|
Crop (18 states)
|
March 31st 2024
|
April 7th 2024
|
5-Year Average
|
|
Corn Planted (%)
Corn Emerged (%)
|
6
0
|
12
3
|
10
2
|
|
Soybean planted (%)
|
3
|
8
|
4
|
| |
|
|
|
|
|
|
|
Crop Condition
(pending USDA reports)
|
V. Poor |
Poor
|
Fair
|
Good |
Excellent |
|
Corn 2024 (%)
Corn 2023 (%)
|
|
|
|
|
|
|
Soybeans 2024 (%)
Soybeans 2023 (%)
|
|
|
|
|
|
| |
|
|
|
|
|
|
|
|
|
Parameter 48 States
|
V. Short |
Short
|
Adequate
|
Surplus |
| Topsoil Moisture: |
|
|
|
|
|
Past Week
Past Year
|
7
11
|
21
17
|
61
59
|
11
13
|
| Subsoil Moisture: |
|
|
|
|
|
Past Week
Past Year
|
9
13
|
24
21
|
58
56
|
9
10
|
| |
|
|
|
|
|
 |
 |
EGG-NEWS will report on the progress of the two major crops as monitored by the USDA through to the end of the 2024 harvest in November.
|
Additional Kroger-Albertson Divestiture Plan Rejected by FTC
|
|
 In an attempt to appease the Federal Trade Commission (FTC), The Kroger Company and Albertsons Companies announced that 166 additional stores will be added to the list that will be divested to C&S Wholesale Grocers for a total of 579 locations. In an attempt to appease the Federal Trade Commission (FTC), The Kroger Company and Albertsons Companies announced that 166 additional stores will be added to the list that will be divested to C&S Wholesale Grocers for a total of 579 locations.
According to a Kroger press release, C&S will operate the Safeway banner in Arizona and Colorado and will license the Albertsons banner in California and Wyoming. Presumably this will be convenient for Kroger and Albertsons should the anticipated transaction be concluded and subsequently C&S goes the way of Haggen after the Safeway transaction in 2016.
 The merger elicited a negative response from the FTC. The Agency stated, “The proposal completely ignores many affected regional and local markets where Kroger and Albertsons compete today.” The statement added, “In areas where there are divestitures, the proposal fails to include all of the access, resources and capabilities C&S will need to replicate the competitive intensity that exists today between Kroger and Albertsons. Even if C&S were to survive as an operation, Kroger and Albertsons proposed divestitures still do not solve the multitude of competitive issues created by the proposed acquisition.” The merger elicited a negative response from the FTC. The Agency stated, “The proposal completely ignores many affected regional and local markets where Kroger and Albertsons compete today.” The statement added, “In areas where there are divestitures, the proposal fails to include all of the access, resources and capabilities C&S will need to replicate the competitive intensity that exists today between Kroger and Albertsons. Even if C&S were to survive as an operation, Kroger and Albertsons proposed divestitures still do not solve the multitude of competitive issues created by the proposed acquisition.”
In support of the proposed merger/acquisition, the CEO of The Kroger Company, Rodney McMullen stated, “Our proposed merger with Albertsons will bring lower prices and more choices to more customers and secure the long-term future of unionized grocery jobs.” McMullen noted that the divestiture plan would ensure that no stores will close, and all frontline associates will remain employed with continuation of existing collective bargaining agreements. The Kroger Company intends to support C&S operations “through expanded transition services.”
|
Albertson’s Posts 4th Quarter and FY 2023 Financial Results
|
|
 In an April 22nd 2024 release, Albertson’s Companies (ACI) posted financial results for the 4th quarter and fiscal 2023 ending February 24th 2024. Earnings were consistent with expectations but sales were lower than consensus estimates. As the second largest pure-grocery company, Albertson’s can be regarded as a bellwether for the retail food industry, subject to increased costs of foods, labor, and transport in a competitive consumer environment impacted by inflation as reflected in low net margins among competitors. In an April 22nd 2024 release, Albertson’s Companies (ACI) posted financial results for the 4th quarter and fiscal 2023 ending February 24th 2024. Earnings were consistent with expectations but sales were lower than consensus estimates. As the second largest pure-grocery company, Albertson’s can be regarded as a bellwether for the retail food industry, subject to increased costs of foods, labor, and transport in a competitive consumer environment impacted by inflation as reflected in low net margins among competitors.
Albertsons operates 2,270 stores under 21 banners including Albertson’s, Safeway, Von’s, Acme, Jewel-Osco and Shaw’s. Albertson’s Companies posted a 1.0 percent increase in same-store sales during the most recent quarter with a 24 percent increase in digital sales over the corresponding Q4 of FY 2022. Loyalty membership increased 16 percent to 39.8 million.
For Q4 net income was $280.5 million on total revenue of $18,340 million. Comparable figures for the fourth quarter of fiscal 2022 ending February 25th 2023 were net income of $311.1 million on total revenue of $18,265 million. Diluted EPS for Class A shares for the most recent quarter was $0.43 down from $0.54 for Q4 FY 2022. Gross margin increased fractionally from 27.8 percent to 28.0 percent denoting minor reduction in cost of goods sold reflecting deflation. Operating income decreased from 2.4 percent in Q4 FY 2022 to 2.3 percent. During Q4 FY 2022 Albertsons recorded a $61.4 million gain on property disposition and $9.5 million assigned to the ‘other income’ category.
For FY 2023 net income was $1,296 million on total revenue of $79,238 million with a diluted EPS of $2.23. Comparable figures for fiscal 2022 ending February 26th 2023 were net income of $1,514 million on total revenue of $77,650 million with a diluted EPS of $2.27
In commenting on results CEO Vivek Sankaran stated, “We delivered another solid quarter amidst a difficult industry backdrop. Again during this quarter, we focused on our strategy to create Customers for Life, which drove strong growth in digital and pharmacy, deepened our omnichannel relationships with our customers and improved our in-store experience”.

Sankaran concluded, "We expect to face ongoing headwinds posed by investments in associate wages and benefits, cycling significant prior year food inflation, lower government assistance for our customers, declining COVID-related income, and the increasing mix of our pharmacy and digital businesses, which carry lower margins. We expect these headwinds to be much stronger in the first half of fiscal 2024. These headwinds are expected, to be partially offset by ongoing productivity initiatives."
On Friday October 14th 2022 Kroger announced a bid for Albertson’s offering $34 per share and assuming $4.7 billion in debt in a $25 billion transaction. The acquisition would at the least have required divestment of stores among in areas with an overlap. Several U.S. senators, states Attorneys General and unions representing Albertson’s workers oppose the transaction. The parties to the merger offered to spin off 413 stores and eight DCs to C&S Wholesalers, since increased by an additional 166 stores. The combined company would invest in worker benefits, devote $1 billion of working capital to reduce prices and would recognize unions.
On January 15th in advance of a Federal Trade Commission decision, the parties issued a joint statement “We remain in active and ongoing dialogue with the FTC and individual state Attorneys General regarding our proposed merger and divestiture plan. We believe our merger with Albertsons and the comprehensive divestiture to C&S will result in the best outcomes for customers, associates and our communities”.
The FTC sued to block the merger in mid-February 2024 supported by eight states and Washington DC. with a hearing to commence on August 12th 2024.
Albertson’s Corporation posted assets of $26,221 million including $3,636 million in goodwill and intangibles, against long-term debt and lease obligations of $15,207 million. The Company had an intraday market capitalization of $11,630 million on April 23rd 2014. ACI trades with a forward P/E of 7.8 and has ranged over a 52-week period from $19.88 to $23.88 with a 50-day moving average of $20.89. Approximately 74 percent of equity is held by institutions with 14 percent by insiders. The Company attained a 12-month trailing operating margin of 2.7 percent and a profit margin of 1.6 percent. Return on assets was 5.6 percent and 58.9 percent on equity.
|
California QSRs Raise Menu Prices Following FAST Act
|
|
Following mandated wage increases in California, national QSR chains and casual dining restaurants have predictably raised menu prices, ostensibly to cover increased wage cost. In accordance with the FAST Act, the minimum wage for fast food chains was $20 per hour effective April 1st.
Studies have shown that menu prices started to rise in October 2023 disproportionately with the rest of the U.S. During March 2024, some fast food and fast casual restaurants increased menu prices by 16.5 percent. The average total increase in menu prices in California was 6.8 percent compared to the national average of 6.7 percent. Increases are regional according to market research company Datassential with higher prices in counties known to have high costs of living. Although the $20 per hour minimum is higher than the average state minimum wage, a shortage of workers resulted in increases in wage rates independently of the FAST Act. Menu increases are inevitable given that labor represents approximately one third of the cost of meals served.
|

 |
|
Foreign-Born U.S. Demographic
|
|

The U.S. Census Bureau released the Foreign-Born Population in the United States: 2022 Report on April 9th. The report includes data on location, education, employment, and health status among forty parameters. The foreign-born cohort includes naturalized citizens, lawful permanent residents, temporary migrants, humanitarian migrants and unauthorized migrants. Collectively these categories represented 13.9 percent of the total population or 46.2 million compared to 12.9 percent or 40.0 million in 2010. States with increases in foreign-born population greater than 40 percent included Delaware, North Dakota, South Dakota and West Virginia. The median age of the foreign-born population increased from 41.4 to 46.7 years compared to the native-born population that increased from 35.9 to 36.9 years of age. In 2022, 75.1 percent of foreign-born residents completed high school or attained higher educational status compared to 68.3 percent in 2010.

Immigrants comprise over 20 percent of the population of California, New Jersey, New York and Florida, ranging from 25.5 percent down to 21.1 percent. Half of the immigrants in the U.S. entered before 2000. Approximately 63 percent of the foreign-born population over the age of 16 was employed, with one-third in management, business or science occupations.

The report suggests that immigrants contribute to the economy of the U.S. and are essential to maintain the population that would otherwise decline. Immigrants in the workforce strengthen social security through their contributions. Without immigrants, payments into the program by an aging and shrinking native-born population of U.S. citizens would require higher contributions or alternatively benefits would have to be reduced to maintain the solvency of the Social Security System.
|
WOAH Concerned over HPAI Impact on Wildlife
|
|
 In a mid-March statement, the World Organization of Animal Health (WOAH) warned of the threat to wildlife from highly pathogenic avian influenza. The statement was prompted by a diagnosis of H5N1 HPAI in skuas collected by scientists at the Primavera Antarctic Research Base operated by Argentine. The WOAH statement included, “Once considered primarily a threat to poultry, HPAI has ushered in a new normal whereby HPAI is moving from wild birds to wild mammals with impacts beyond anything previously seen.” The statement continued, “At the latest count there have been 485 species from over 25 avian orders affected and 37 new mammal species infected since 2021. Only the Pacific Islands, Australia and New Zealand remain free of the disease, but the situation is changing rapidly.” In a mid-March statement, the World Organization of Animal Health (WOAH) warned of the threat to wildlife from highly pathogenic avian influenza. The statement was prompted by a diagnosis of H5N1 HPAI in skuas collected by scientists at the Primavera Antarctic Research Base operated by Argentine. The WOAH statement included, “Once considered primarily a threat to poultry, HPAI has ushered in a new normal whereby HPAI is moving from wild birds to wild mammals with impacts beyond anything previously seen.” The statement continued, “At the latest count there have been 485 species from over 25 avian orders affected and 37 new mammal species infected since 2021. Only the Pacific Islands, Australia and New Zealand remain free of the disease, but the situation is changing rapidly.”

The WOAH Working Group on Wildlife has produced guidelines on vaccination of species under conservation. California Condors have been vaccinated under special license in the U.S. following mortality presumably from scavenging dead waterfowl.
The WOAH notes that the magnitude of losses “at the current scale presents an unprecedented risk of wildlife population collapse creating an ecological crisis.”
The WOAH emphasizes the need for interagency coordination and collection of data through the World Animal Health Information System.
EGG-NEWS has reported on outbreaks involving high mortality in numerous wild avian species including cranes in Israel and India, swans in the E.U., Dalmatian pelicans and endangered barnacle geese. (retrievable by entering “avian influenza” in the SEARCH block). The recovery of H5N1 HPAI virus from free-living birds including grackles and blackbirds associated with bovine influenza-H5N1 suggests that the infection is now endemic in the U.S. and is not confined to migratory waterfowl.
|
France Implementing Vaccination Program
|
|

|
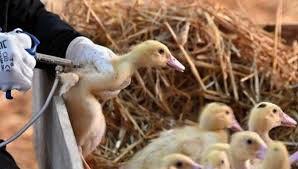
Following successive years of severe losses as a result of exposure to HPAI, France initiated a preventive vaccination program in ducks and geese reared for the foie gras segment of their poultry industry. To date 26 million waterfowl have received the initial dose of vaccine with 21 million receiving a second booster dose.
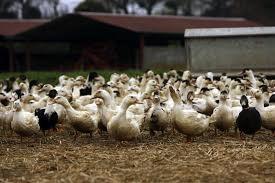
During the 2022-2023 epornitic of HPAI, 315 farm outbreaks were recorded with 22 million commercial birds depopulated. Since the autumn of 2023, ten cases have been diagnosed.
The success of the vaccination program will be confirmed by an analysis of data relating to outbreaks following a complete season with direct comparisons between vaccinated and non-vaccinated susceptible flocks.
|
|
Friends of the Earth Campaigning Against Intensive Livestock Production
|
|
 Following the lead of U.K. Environmental and Animal Rights Organizations, Friends of the Earth have initiated a campaign opposing intensive livestock production. The organization is focusing on major banks including JPMorgan, Chase, Citi Group and Bank of America as providing finance for livestock production. Following the lead of U.K. Environmental and Animal Rights Organizations, Friends of the Earth have initiated a campaign opposing intensive livestock production. The organization is focusing on major banks including JPMorgan, Chase, Citi Group and Bank of America as providing finance for livestock production.
Although disguised as a pro-environmental issue to reduce global emissions, the initiative finds common cause with traditional opponents of production of animal meat including groups advocating a vegan lifestyle.
|
Growth in Size of Container Vessels Represents Increased Risk
|
|
 The recent collision of mv Dali with the Francis Scott Key Bridge highlights the size of container vessels and their potential for damage. The accident caused loss of six lives, and as yet uncalculated costs for replacement and the considerable inconvenience including closing of the Baltimore Harbor. Following an inquiry appropriate preventive measures will be issued including the mandatory accompaniment of large vessels by tugs to avert collisions in the event of loss of propulsion The Dali constructed in 2015 as a Super Panamax container carrier has a beam of 158 ft and a length of 984 ft and can carry 10,000 20-ft equivalent container units (TEUs). At the time of the accident, Dali was loaded at over 90 percent capacity. Super Panamax carriers have transited the Panama Canal since 2016 and can be accommodated in ports with a channel of suitable depth and appropriate offloading installations. The largest vessels now afloat can carry up to 24,000 TEUs and are over 1,300 ft in length. The recent collision of mv Dali with the Francis Scott Key Bridge highlights the size of container vessels and their potential for damage. The accident caused loss of six lives, and as yet uncalculated costs for replacement and the considerable inconvenience including closing of the Baltimore Harbor. Following an inquiry appropriate preventive measures will be issued including the mandatory accompaniment of large vessels by tugs to avert collisions in the event of loss of propulsion The Dali constructed in 2015 as a Super Panamax container carrier has a beam of 158 ft and a length of 984 ft and can carry 10,000 20-ft equivalent container units (TEUs). At the time of the accident, Dali was loaded at over 90 percent capacity. Super Panamax carriers have transited the Panama Canal since 2016 and can be accommodated in ports with a channel of suitable depth and appropriate offloading installations. The largest vessels now afloat can carry up to 24,000 TEUs and are over 1,300 ft in length.
 In 1980, the Summit Venture collided with the Sunshine Skyway Bridge near Tampa resulting in 35 fatalities and requiring reconstruction of the bridge with appropriate protective installations. A near collision was avoided this past week when mv Qingdao 1,100 feet in length and 98,000tons, lost propulsion in the Kill van Kull waterway. Three attending tugs together with three other vessels secured the carrier to avoid any possible contact with the Verrazzano-Narrows Bridge. In March 2021, mv Ever Given a 20,000 TEU vessel, 1,300 feet in length blocked the Suez Canal for six days before being refloated. The incident restricted passage through the canal for over 400 vessels resulting in costs exceeding $1 billion. In 1980, the Summit Venture collided with the Sunshine Skyway Bridge near Tampa resulting in 35 fatalities and requiring reconstruction of the bridge with appropriate protective installations. A near collision was avoided this past week when mv Qingdao 1,100 feet in length and 98,000tons, lost propulsion in the Kill van Kull waterway. Three attending tugs together with three other vessels secured the carrier to avoid any possible contact with the Verrazzano-Narrows Bridge. In March 2021, mv Ever Given a 20,000 TEU vessel, 1,300 feet in length blocked the Suez Canal for six days before being refloated. The incident restricted passage through the canal for over 400 vessels resulting in costs exceeding $1 billion.
|
Trucking Industry Experiencing Downturn in Rates and Earnings
|
|
 In contrast to the COVID years and shortly thereafter, freight rates have declined for both negotiated and spot markets. Retailers and distributors are holding inventories at low levels and are aggressive in negotiating prices. In contrast to the COVID years and shortly thereafter, freight rates have declined for both negotiated and spot markets. Retailers and distributors are holding inventories at low levels and are aggressive in negotiating prices.
As with any commodity rates are determined by supply and demand. Trucking capacity now exceeds demand resulting in extreme competition and lower prices. The downward trend will continue until balance is restored according to an analyst at J.P. Morgan.
Since mid-2020, 325,000 carrier units have entered the industry with 231,000 departures. Many trucking companies are burning through accumulated profits earned during the COVID years. The questions are whether rates have now bottomed after the prolonged slump and if there are prospects for increases as retailers restock distribution centers.
|
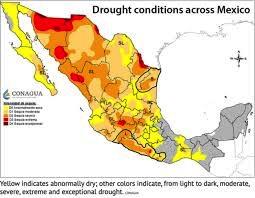
Drought in Mexico to Reduce Corn Yield
|
|
White corn, a carbohydrate staple in Mexico will be impacted by an ongoing drought. The state of Sinaloa that grows white corn in winter is severely impacted according to a USDA spokesperson who has knowledge of the area. Dry conditions prevailed in the fall before planting and soil moisture has deteriorated since the start of the season. Reservoirs in the State have less than 15 percent of their capacity eliminating the possibility of irrigation.

The cost of white corn is a major concern for the Government of Mexico especially in an election year. Inflation in the price of tortillas and other basic foods is inevitable. It is noted that AMLO, the President of Mexico previously issued a decree banning importation of GMO yellow corn for human consumption. There is limited availability of white corn from the U.S. that could supplement supplies in Mexico. This will result in inevitable shortages and higher prices absent Government intervention and support.
|

|
|
National Fire Protection Association Proposing Sprinkler Systems
|
|
 The National Fire Protection Association has introduced draft standards for installation of sprinkler systems in animal housing. It is noted that there have been a number of fires in layer houses including recently erected units. The National Fire Protection Association has introduced draft standards for installation of sprinkler systems in animal housing. It is noted that there have been a number of fires in layer houses including recently erected units.
The UEP has filed a notice of intent to request deletion of the draft standard. Installation of sprinkler systems would obviously add cost to new housing but might be offset by reduced insurance rates.
 Prism Control Systems has developed the ThERM® Fire Detection and Response System*. A series of sensors detects high temperature and airborne particulates associated with a fire. The system responds by initiating alarms and inactivating fans that accelerate the progress of a fire. Prism Control Systems has developed the ThERM® Fire Detection and Response System*. A series of sensors detects high temperature and airborne particulates associated with a fire. The system responds by initiating alarms and inactivating fans that accelerate the progress of a fire.
With larger house capacity and more expensive construction and installations, it is essential that all new and retrofitted housing conform to safety codes. For new construction, flammability of construction and insulation materials should be considered in addition to selecting fire detection and suppression installations.

*Details of ThERM can be downloaded from the Prism Controls website, accessed by clicking on to the Company logo on the right side of the Welcome page
|
Food Insecurity in the U.S.
|
|
 The Bureau of Census and the Economic Research Service of USDA determined the prevalence of food insecurity across ethnic and economic groups in the U.S. A recent report evaluated data from 214,000 households gathered from 2016 through 2021. The prevalence of food insecurity ranges from 5.4 percent for Asian households to 23.3 percent for American Indian and Alaskan native households. This category experienced difficulty in obtaining sufficient food due to lack of disposable income. The Bureau of Census and the Economic Research Service of USDA determined the prevalence of food insecurity across ethnic and economic groups in the U.S. A recent report evaluated data from 214,000 households gathered from 2016 through 2021. The prevalence of food insecurity ranges from 5.4 percent for Asian households to 23.3 percent for American Indian and Alaskan native households. This category experienced difficulty in obtaining sufficient food due to lack of disposable income.
Very low food security was experienced by 1.6 percent of Asian households but up to 11.3 percent for native American-White multiracial households. In this category, food intake was rationed and the number of meals was reduced due to lack of availability. The report also noted diversity within ethnic groups. Food insecurity among Japanese households categorized within the Asian demographic was at 1.7 percent compared to 11.4 percent for other Asian households.
 Among all U.S. households 12 percent were insecure and 4 percent experienced low levels of food security. The highest affected groups comprised Black Americans with 22 percent of households insecure and 8 percent experiencing low food security. White households in contrast showed 7 percent insecurity and 3 percent extremely low food security. Hispanic households were intermediate with 16 percent insecure and 6 percent reporting low food security. Among all U.S. households 12 percent were insecure and 4 percent experienced low levels of food security. The highest affected groups comprised Black Americans with 22 percent of households insecure and 8 percent experiencing low food security. White households in contrast showed 7 percent insecurity and 3 percent extremely low food security. Hispanic households were intermediate with 16 percent insecure and 6 percent reporting low food security.
The extent of food insecurity is an unfortunate reality in a nation with the largest GDP in the world. The magnitude of the problem should be considered in relation to the current conflicts within the House and Senate Agriculture Committees that have failed to produce an acceptable Farm Bill. This is mainly due to division along party lines as to the relative expenditures on SNAP and WIC relative to agricultural support prices.
|
Trader Joe’s Store Fined by OSHA
|
|
 With overtones of recent action against dollar stores, a Trader Joe’s location in Greenwood Village, CO. was fined $200,000 by the Occupational Safety and Health Administration (OSHA). At issue were contraventions of worker safety regulations by a repeat offender. The store was previously cited for blocking access to electrical switchgear, failure to implement a program of training for forklift operators and deficiencies in maintenance. The defects observed at the Colorado store have also been documented at Trader Joe’s locations in five eastern states. With overtones of recent action against dollar stores, a Trader Joe’s location in Greenwood Village, CO. was fined $200,000 by the Occupational Safety and Health Administration (OSHA). At issue were contraventions of worker safety regulations by a repeat offender. The store was previously cited for blocking access to electrical switchgear, failure to implement a program of training for forklift operators and deficiencies in maintenance. The defects observed at the Colorado store have also been documented at Trader Joe’s locations in five eastern states.

In commenting on the action, Chad Vivian, OSHA Area Director for Colorado stated, “Employees must comply with all Federal safety standards including forklift training and keeping areas around electrical equipment clear to prevent injuries and fatal accidents.” He concluded, “We will continue to cite companies that fail to implement the measures necessary to protect their employees from these hazards.”
|
Survey Confirms Consumers Searching for Value in Protein
|
|
 John Cleaver writing in Meating Place noted the report from market survey company 84.51 Inc. relating to the purchase protein foods. The survey determined that 37 percent of consumers are downgrading meat purchases according to unit cost. This has impacted sales of higher-priced organic meat. Approximately 40 percent of consumers surveyed were stretching their protein expenditure by purchasing soups and products to extend inclusion of meat in home-prepared food. Unnecessary food purchases including snacks and high-priced discretionary items are avoided in an attempt to reduce expenditure on food now rising at an annual inflation rate of two percent. John Cleaver writing in Meating Place noted the report from market survey company 84.51 Inc. relating to the purchase protein foods. The survey determined that 37 percent of consumers are downgrading meat purchases according to unit cost. This has impacted sales of higher-priced organic meat. Approximately 40 percent of consumers surveyed were stretching their protein expenditure by purchasing soups and products to extend inclusion of meat in home-prepared food. Unnecessary food purchases including snacks and high-priced discretionary items are avoided in an attempt to reduce expenditure on food now rising at an annual inflation rate of two percent.
 Given that demand for eggs after Easter has not fallen as in previous years it is possible that consumers recognize their nutritional value and are opting for egg dishes as eat-at-home lunch and dinner servings. This is consistent with shoppers searching for value including the use of coupons, buying in bulk from club stores and taking advantage of promotions and discounts. Given that demand for eggs after Easter has not fallen as in previous years it is possible that consumers recognize their nutritional value and are opting for egg dishes as eat-at-home lunch and dinner servings. This is consistent with shoppers searching for value including the use of coupons, buying in bulk from club stores and taking advantage of promotions and discounts.
|
Self-Checkout Subject to New Obstacles
|
|
 In recent weeks both dollar store chains and Target Corporation have placed restrictions on self-checkout following evident theft and inadvertent errors in scanning. Now state and local legislators have recognized the negative effect on employment by displacing checkout clerks. California Senate Bill 1446 has been reintroduced to require grocery and pharmacy retailers to employ at least one dedicated clerk per two self-checkout stations. This would negate the cost saving that was in fact the objective of the technological innovation. In recent weeks both dollar store chains and Target Corporation have placed restrictions on self-checkout following evident theft and inadvertent errors in scanning. Now state and local legislators have recognized the negative effect on employment by displacing checkout clerks. California Senate Bill 1446 has been reintroduced to require grocery and pharmacy retailers to employ at least one dedicated clerk per two self-checkout stations. This would negate the cost saving that was in fact the objective of the technological innovation.
 Maine is also considering a levy on self-checkout in the form of an obligatory discount since in the words of the proponent of the legislation, the stores are making “customers do the work performed by employees”. It is understood that City of Evanston, IL is considering a special tax of $5,000 on every self-checkout station in a store. Maine is also considering a levy on self-checkout in the form of an obligatory discount since in the words of the proponent of the legislation, the stores are making “customers do the work performed by employees”. It is understood that City of Evanston, IL is considering a special tax of $5,000 on every self-checkout station in a store.
From personal experience, self-checkout is convenient to purchase up to four items but only if all packages are barcoded. Problems occur with food and produce and self-serve floral arrangements. A second problem relates to a wide variation in operation of self-service kiosks. On-screen and audible instructions are often confusing although once familiar with a specific system, bar-coded items can be scanned with the advantage of skipping a congested checkout lane. Aldi should be complemented on their self-scan checkout which is simple to operate and reliable even for non-techie octogenarians.
|
Consumer Reports Identifies High Sodium, and Lead Contamination in Lunchables®
|
|
 It appears that Consumer Reports has fired up its atomic absorption spectrophotometer. They recently published on “detectable” levels of lead in a turkey and cheddar cracker product manufactured by Kraft-Heinz and supplied to the USDA for the National School Lunch Program. In addition, sodium content at 930 mg per serving was higher than the store-available equivalent product at 740 mg. It appears that Consumer Reports has fired up its atomic absorption spectrophotometer. They recently published on “detectable” levels of lead in a turkey and cheddar cracker product manufactured by Kraft-Heinz and supplied to the USDA for the National School Lunch Program. In addition, sodium content at 930 mg per serving was higher than the store-available equivalent product at 740 mg.
 It is noted that the levels of lead and cadmium were lower than FDA limits and in all probability represented natural background content. Naturally Consumer Reports is generating pressure for USDA to recall product from the School Feeding Program having launched a petition drive that has generated 16,000 signatures. Brian Ronholm, Director of Food Policy at Consumer Reports stated, “Lunchables are not a healthy option for kids and should not be allowed on the menu as part of the National School Lunch Program. It is noted that the levels of lead and cadmium were lower than FDA limits and in all probability represented natural background content. Naturally Consumer Reports is generating pressure for USDA to recall product from the School Feeding Program having launched a petition drive that has generated 16,000 signatures. Brian Ronholm, Director of Food Policy at Consumer Reports stated, “Lunchables are not a healthy option for kids and should not be allowed on the menu as part of the National School Lunch Program.
The USDA is considering a reduction in sodium limits for school meals with a 1,110 mg weekly intake for elementary students and up to 1,280 mg for high school students but with an additional 30 percent reduction over the proximal five years.
Kraft-Heinz maintains that the quality of Lunchables® products meet USDA requirements and that the company increased the level of meat to provide more protein, possibly responsible for the differential in sodium content between store and school-served products.
|
Concern in Latin America over El Nino Transition to a La Nina Event
|
|
 Over many decades, the regular transition from El Nino to La Nina events with a neutral intermediate period has occurred over three-to-seven-year cycles. More recently, for conditions that are not fully understood, transitions are occurring over shorter periods and the intensity of drought associated with La Nina and floods and hurricanes concurrent with an El Nino are becoming more intense. Over many decades, the regular transition from El Nino to La Nina events with a neutral intermediate period has occurred over three-to-seven-year cycles. More recently, for conditions that are not fully understood, transitions are occurring over shorter periods and the intensity of drought associated with La Nina and floods and hurricanes concurrent with an El Nino are becoming more intense.
The International Research Center for the El Nino Phenomenon noted, “A year ago we came out of a La Nina and in March there were signs of a transition to El Nino. Rapid changes in the cycle will undoubtedly impact crop production with corresponding economic effects”.
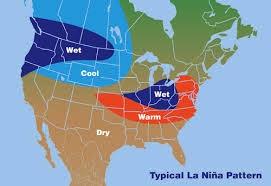
It is noted that the intense La Nina over the past three years was responsible for drought-reated low yields for crops in Chile and Peru. Reduced water flow through the Panama Canal, has restricted passage of vessels and has raised the cost of ocean transport. The ongoing El Nino was expected to restore water levels in the Canal but with an unexpected and abrupt return to a La Nina the unfavorable situation may persist.
|
Fur Farms in China Represent a Potential for the Emergence of Pandemics
|
|
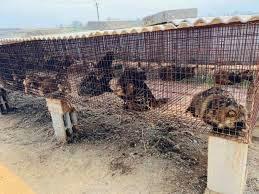
A review of fur farms in Hebei and Liaoning Provinces revealed risks for the emergence of pandemic strains of zoonotic viruses according to Dr. Alastair MacMillan of Surrey University, U.K. Holding as many as 4,000 animals of diverse species including foxes, raccoon dogs and mink represented a potential for viruses to undergo mutation and recombinant events. The risk was intensified by proximity to farms housing high concentrations of commercial poultry.

During the early stages of the COVID pandemic in China, restrictions were placed on fur farms in addition to the breeding and consumption of exotic animals as food. It appears that restrictions have either been ignored or rescinded.
EGG-NEWS is opposed to fur farming in the U.S., the E.U., China or anywhere else based on the fact that commercial production may lead to emergence of zoonotic viruses. The end-product of fur farming has as its objective satisfaction of vanity and ostentatious display of wealth.
|

|
|
Target Lawsuit over Biometrics Surveillance
|
|
 The Biometric Information Privacy Act enacted in 2008 in the state of Illinois provided protection to customers from undisclosed collection and use of biometric data. The Biometric Information Privacy Act enacted in 2008 in the state of Illinois provided protection to customers from undisclosed collection and use of biometric data.
Target along with numerous retailers is plagued with theft and has introduced systems to identify serial shoplifters. The Illinois Act makes it unlawful for a company to “collect, capture, purchase, receive or otherwise obtain a person’s biometric identifiers without informed consent and approval in writing.”
The application of biometric surveillance is highly contentious. Rite Aid agreed to cease using facial recognition technology following action by the Federal Trade Commission. Defects in the technology used incorrectly identified innocent shoppers as potential serial shoplifters.
Facial recognition technology has many drawbacks including differentiation among people of color. Identifying individuals in large groups is practiced by the Government of the People’s Republic of China to identify political dissidents and potential provocateurs in street gatherings.
|
Sale of Grubhub Contemplated
|
|
 Parent company Just Eat based in the Netherlands is actively seeking a buyer for their Grubhub operation in the U.S. Parent company Just Eat based in the Netherlands is actively seeking a buyer for their Grubhub operation in the U.S.

Just Eat processed 214 million orders in all their operations during the first quarter of FY 2024, down six percent from the corresponding quarter of FY 2013. Transaction value was down 1.8 percent to $7.0 billion for the most recent quarter.
|
Farmerboy Barntalk
|
|
Crimson Holdings LLC files for Chapter 11 Protection
|
|

On April 8th, Crimson Holdings LLC an egg breaking enterprise located in Adrian Wisconsin filed for Chapter 11 protection.

The facility was the production unit of OvaInnovations Inc. and was converted to processing inedible product from a milk drying plant. From the inception of operation, the plant was associated with resident complaints over odor, investigated by the state environmental agency. The operation was embroiled in legal action including a dispute with IsoNova Technologies LLC.

David Rettig was the moving force behind OvaInnovations Inc. Rettig was instrumental in establishing Rembrandt Enterprises in 1999 with financing provided by entrepreneur Glenn Taylor of Minneapolis. In 2009 Rembrandt acquired Golden Oval eggs. Rembrandt was impacted by two episodes of highly pathogenic avian influenza. The production facility in Rembrandt, Iowa is now owned and operated by AGR Partners.
|
Sanovo Introduces GraderPro 800
|
|
 Sanovo Technology Group has introduced the GraderPro 800 with a capacity of 288,000 eggs per hour corresponding to 800 cases. To accommodate this volume the system incorporates two infeed lines. The tunnel operates with eight tracks allowing the GraderPro 800 to operate at a track speed approximately 25 percent lower than competitors’ graders. Sanovo Technology Group has introduced the GraderPro 800 with a capacity of 288,000 eggs per hour corresponding to 800 cases. To accommodate this volume the system incorporates two infeed lines. The tunnel operates with eight tracks allowing the GraderPro 800 to operate at a track speed approximately 25 percent lower than competitors’ graders.

The GraderPro installation features cleaning in place, recycling of ‘grey’ water and cleaning of modules without disassembly. All machine parts incorporate approved food-contact material. Operation and monitoring is based on an advanced touchscreen console.
Modules compatible with the GraderPro 800 include the Sanovo OptiAccumulator with a compatible OptiLoader, UV disinfection, VisionAI grading, Blood Detector and Inkjet Printing to conform to EU requirements. Configuration of the installation allows for a small footprint relative to volume permitting retrofitting in existing plants and reducing the required floor area for new buildings.

The GraderPro 800 incorporates egg tracking to farm or flock of origin for comprehensive traceability.
|
Commentary
|
|
|