Editorial
PEAK 2024 an Outstanding Success
|
|
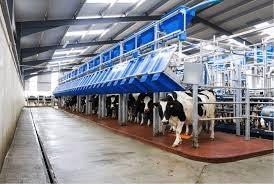
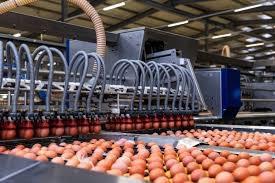
 PEAK 2024 organized by the Midwest Poultry Federation is now well established in the Minneapolis Convention Center that provides more exhibition space, meeting rooms and hotel accommodation that the previous St. Paul location. The trade exhibition consistently attracts more egg-related allied suppliers compared to the IPPE. The concurrent industry association meetings and educational programs are focused on egg production given the concentration of farming operations in six Midwest states. Although space limits the display of large displays including 700-case per hour graders and a range of aviary equipment, technical personnel are available on booths to discuss operational parameters supplemented by videos, models, components and short cross-sections of installations. PEAK 2024 organized by the Midwest Poultry Federation is now well established in the Minneapolis Convention Center that provides more exhibition space, meeting rooms and hotel accommodation that the previous St. Paul location. The trade exhibition consistently attracts more egg-related allied suppliers compared to the IPPE. The concurrent industry association meetings and educational programs are focused on egg production given the concentration of farming operations in six Midwest states. Although space limits the display of large displays including 700-case per hour graders and a range of aviary equipment, technical personnel are available on booths to discuss operational parameters supplemented by videos, models, components and short cross-sections of installations.
 Educational programs presented included the North Central Avian Disease Conference, the Organic Egg Farmers of America Symposium, the Devenish Nutrition Symposium, and a number of informal gatherings taking advantage of attendance at the event. Educational programs presented included the North Central Avian Disease Conference, the Organic Egg Farmers of America Symposium, the Devenish Nutrition Symposium, and a number of informal gatherings taking advantage of attendance at the event.
The Midwest Poultry Federation arranged a series of educational presentations for pullet and egg management, feed technology and business leadership. During the trade exhibition, poultry TED Talks were presented detailing innovations in products and management for the benefit of attendees. Entertainment included PEAK Unhatched, an Exhibition-floor Happy Hour and Hospitality Night.
Despite the prevailing favorable margins in egg production, there were a number of overhangs that detracted from optimism:
- The resurgence of highly pathogenic avian influenza with three complexes affected since the beginning of April requiring depopulation of close to six million hens in two states was the major issue of concern. It is evident that HPAI is no longer limited to seasonal epornitics but has expanded beyond the migration of waterfowl in spring and fall months. This is in all probability due to transfer of the H5N1 virus to non-migratory species of free-living birds. This is evidenced by dead grackles and pigeons yielding H5N1 virus in the vicinity of the index dairy farm in Texas that was affected with Bovine Influenza-H5N1. Outbreaks of HPAI have been regularly diagnosed on a weekly basis in backyard flocks in diverse states outside the migratory seasons. These small flocks serve as sentinels for the presence of avian influenza virus and many cases are not diagnosed. Sometime in 2024 the USDA-APHIS will have to accept regional vaccination for turkeys and egg-production flocks. It must be obvious by now that it is futile to attempt to eradicate an endemic infection spread by the aerosol route in addition to fomites.
- The impasse in Congress is impeding passage of legislation necessary to maintain agricultural production. The Farm Bill is mired in dissent in both the Senate and House Agricultural Committees with polarization separating left and right-leaning members. Ultimately there will have to be compromise on the two issues of contention represented by allocations for SNAP and WIC favored by the left and diversion of funds from climate change programs to commodity price support on the right. The 118th Congress has barely passed fifty bills as opposed to an anticipated 400 in a normal two-year period. Appropriations bills were delayed by months by resorting to stop-gap continuing resolutions. Both parties are to blame for their lack of commitment to the national interest caused by grandstanding and intra-party conflict.

- There was considerable talk in the hallways at PEAK of consolidation in the retail food sector. The proposed merger between the Kroger Company and Albertsons Corporation is a concerning issue since this would create more buying power for the chains that are readily able to adjust orders to influence the industry benchmark price discovery system to the disadvantage of producers.
- There are concerns over the economy. The Federal Reserve has obviously reduced inflation from 8.9 to 3.5 percent but is experiencing difficulty in reducing levels to the target of 2.0 percent. International conflict and the price of energy are adding to the burden of inflation that is reducing consumer spending despite the last hurrah of extravagance during the first quarter of 2024.
- As in all planting seasons, there is concern over the anticipated crop. With the projected cyclic transition from a La Nina to an El Nino event, weather patterns during the 2024 growing season will influence yields. Lower feed prices have contributed to positive margins over the past twelve months but an unfortunate combination of higher input costs with production exceeding demand may impact profitability in the late third and early fourth quarters.
It is hoped that the contributions derived from PEAK 2024 in the form of technical and trade information will be transferred from the event to all U.S. production units and companies with evident improvements in productivity and profitability.

|
Egg Industry News
Crop Progress
|
|
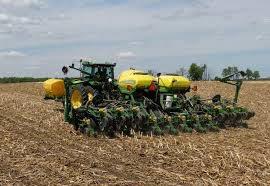
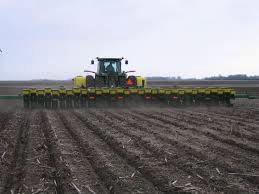
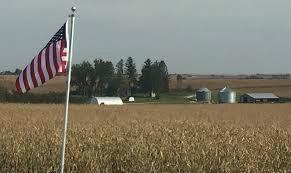
Status of the 2024 Corn and Soybean Crops
The USDA Crop Progress Report released on April 15th documented planting for the 2024 soybean and corn season. Farmers are in fields with relatively dry conditions in half of the eight major states producing corn and soybeans allowing rapid seeding of prepared acreage. The “big-eight” (IL, IN, IA, KS, MI, MN and OH) collectively averaged 3.5 days suitable for field work this past week ranging from 0.7 days (OH) to 6.3 days (KS)
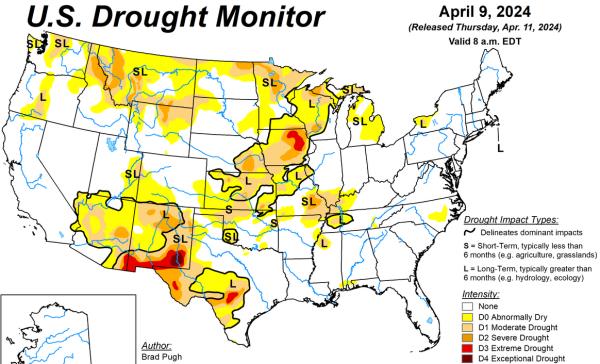
Based on the sum of the “adequate” and “surplus” categories, surface and subsoil moisture levels were equivalent to the corresponding week in 2023. For the past week surface and subsoil moisture values were 70 and 66 percent respectively for the two highest categories. These levels were similar to the previous year with values of 66 percent and 66 percent respectively for the two highest categories, demonstrating an acceptable pre-planting situation. It is to early in the expected transition to an El Nino event to predict any impact on crop condition in coming weeks. If dry and warm weather in corn and soy areas occurs yield may be depressed depending on timing and severity.
Reference is made to the April 11th WASDE Report #647 under the STATISTICS TAB and the weekly Commodity, Economy and Energy Report in this edition, documenting acreage to be harvested, yields, weekly prices and ending stocks.
| |
WEEK ENDING |
|
|
Crop
|
March 31st 2024
|
April 7th 2024
|
5-Year Average
|
|
Corn planted
(18 states) (%)
|
3
|
6
|
5 |
|
Soybean planted
(18 states) (%)
|
0
|
3
|
1
|
| |
|
|
|
|
|
|
|
Crop Condition
(pending USDA reports)
|
V. Poor |
Poor
|
Fair
|
Good |
Excellent |
|
Corn 2024 (%)
Corn 2023 (%)
|
|
|
|
|
|
|
Soybeans 2024 (%)
Soybeans 2023 (%)
|
|
|
|
|
|
| |
|
|
|
|
|
|
|
|
|
Parameter 48 States
|
V. Short |
Short
|
Adequate
|
Surplus |
| Topsoil Moisture: |
|
|
|
|
|
Past Week
Past Year
|
8
11
|
22
18
|
56
59
|
14
12
|
| Subsoil Moisture: |
|
|
|
|
|
Past Week
Past Year
|
10
13
|
24
21
|
55
57
|
11
9
|
| |
|
|
|
|
|
 |
|
|
EGG-NEWS will report on the progress of the two major crops as monitored by the USDA through to the end of the 2024 harvest in November.
|
Egg Week
|
|
USDA Weekly Egg Price and Inventory Report, April 17th 2024.
 Market Overview Market Overview
- The average wholesale unit revenue values for Midwest Extra-large, Large and Medium sizes were unchanged this past week. Wholesale prices for Midwest in cartons were approximately 50 cents per dozen above the 3-year average of $2.00 per dozen and up $0.25 from the corresponding week in 2023 at $2.25 per dozen. This past week shell egg inventory was down by 1.4 percent percent, following a noteworthy rise of 10.3 percent the previous week.
- Although there has been a weekly increase in pullet flocks transferred to laying houses, hen numbers are constrained by the loss of close to 13 million hens due to HPAI on twelve complexes holding from 250,000 to 2.6 million hens during the 4th Quarter of 2023. Pullets are in short supply with losses of 2.5 million growing birds, mainly in California. Since the beginning of April close to 8.4 million hens collectively have been depopulated in one complex in Texas and three related complexes in Michigan.
- This past week chains apparently narrowed the spread between delivered cost and shelf price. This could result in a continued reduction in generic stock with a proportional rise in demand but only with constant re-ordering to fill the pipeline into May. Discounters are holding prices on generics influencing mainstream retail stores. Eggs are still highly competitive in price against the comparable costs for other protein foods.
- Total industry inventory was down by 0.8 percent overall this past week to 1.62 million cases with a concurrent 1.9 percent increase in breaking stock, following a 0.8 percent fall during the preceding processing week. Demand for egg products continues after the Easter weekend with more home baking and entertaining. Egg products are required for the food service and manufacturing sectors and exports increased in February.
- It is now apparent that the inventory held by chains and other significant distributors may be more important over the short term in establishing wholesale price compared to the USDA regional inventory figures. Changes in stock held by DCs and in the pipeline as determined by weekly orders are probably responsible for small cyclic fluctuation in weekly industry stock, especially into and after a holiday weekend.
- Cases of HPAI in the commercial poultry industry and backyard (non-commercial WOAH) flocks tapered during the first quarter of 2024, coincident with the end of the Fall migration of waterfowl that was extended in late 2023 by mild weather. The emergence of the infection in a large complex holding 1.8 million hens and 340,000 pullets in western Texas suggests a reoccurrence as northward spring migration commences. The third and fourth related cases in Michigan involving three complexes with a total of 6.4 million hens may have started as an indirect extension from an infected dairy herd although an epidemiologic evaluation in progress will be required to confirm the source and route of dissemination. The number and extent of future possible outbreaks during the spring and fall months of 2024 cannot be projected but sporadic cases in backyard poultry and 27 dairy herds in eight widely diverse states is a cause for concern. More surveillance information should be released by USDA-APHIS as it becomes available concerning the prevalence rate of carriers among resident domestic free-living birds and a review of molecular and field epidemiology for the 2022 spring and fall waves of HPAI. The USDA has yet to identify specific modes of transmission for the 2022-2023 epornitic including likely airborne spread from wild birds and their excreta over short distances.
- The current relationship between producers and chain buyers based on a single commercial price discovery system constitutes an impediment to a free market. The benchmark price appears to amplify both downward and upward swings as evidenced over the past two years. A CME quotation based on Midwest Large, reflecting demand relative to supply would be more equitable. If feed cost is determined by CME ingredient prices then generic shell eggs should be subject to a Midwest Large quotation.
- According to the USDA the U.S. flock in production was apparently down by 0.2 million hens (<0.1 percent) to a new level of 306.1 million for the week ending April 17th The stated total flock of 311.7 million included about one million molted hens that will resume lay during coming weeks plus 4.5 million pullets scheduled to attain production. Given the latest figures it is estimated that the producing flock is at least 17 to 20 million hens lower than before the onset of HPAI in 2022. In January 2024 the USDA adjusted figures to account for depopulation of 13 million hens spread over the last quarter of 2023. There were evident discrepancies between published figures and the theoretical number of hens taking into account known losses and predetermined pullet replacements. The April loss of 8.4 million hens is not reflected in data released over the past three weeks. It is hoped that the USDA Agency responsible for publication of flock size will get their act together and coordinate with APHIS to record the number of depleted flocks and promptly provide accurate data.
- The ex-farm price for breaking stock (rounded to one cent) was unchanged at $1.58 per dozen.Checks delivered to Midwest plants were unchanged at $1.42 per dozen this past week. Prices for breaking stock should follow the wholesale price for shell eggs usually with a lag of about one to two weeks.
The Week in Review
Prices
According to the USDA Egg Market News Reports released on April 15th 2024, the Midwest wholesale price (rounded to one cent) for Extra-large was unchanged from last week at $2.43 per dozen. Large was unchanged at $2.41 cents per dozen. Mediums were unchanged at $2.30 per dozen delivered to DCs. Prices should be compared to the USDA benchmark average 4-Region blended nest-run cost of 75.3 cents per dozen as determined by the Egg Industry Center based on USDA data for March 2024. This value excludes provisions for packing, packaging materials and transport, amounting to 57 cents per dozen as determined in mid-2023 from an EIC survey (with low response) and now realistically 60 cents per dozen.
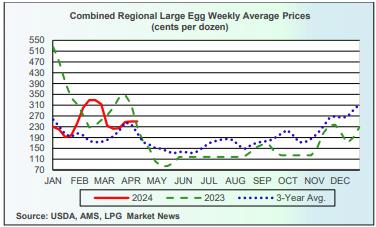
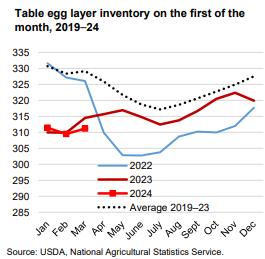
Currently producers of generic shell eggs should be operating with positive margins irrespective of region and customer-supply agreements. The progression of prices during 2023 and 2024 to date is depicted in the USDA chart reflecting three years of data, updated weekly.
The April 15th edition of the USDA Egg Market News Report confirmed that the USDA Combined Region value (rounded to the nearest cent), was unchanged at $2.50 per dozen delivered to warehouses for the week ending April 9th 2024. This average price lags current benchmark Midwest weekly values by one week. The USDA Combined range for Large in the Midwest was $2.41 per dozen. At the high end of the range, the price in the South Central region attained $2.57 per dozen. The USDA Combined Price last week was approximately 50 cents per dozen above the 3-year average of $2.00 per dozen. This past week Midwest Large was approximately $0.25 per dozen above the corresponding week in 2023 that was falling from a peak price to $2.25 per dozen as production recovered from HPAI depletion but with declining market demand.
Flock Size
Previously the loss of approximately 13 million hens due to HPAI during the fourth quarter was not reflected in weekly USDA figures until the beginning of February. The loss of 3.5 million hens in April to date is NOT reflected in current data. Increases in flock size during late February and early March amounted to fractions of a percent. The USDA belatedly published data to reflect previous losses due to HPAI depopulation and molted flocks reentering production during the post-Easter period but has yet to update figures for depletion in April.
Given the importance of weekly flock numbers to pricing, accurate values for producing and total flock are required by producers.

|
Commodity Report
|
|
WEEKLY ECONOMY, ENERGY AND COMMODITY REPORT: April 18th 2024.
OVERVIEW
 Prices for corn and soybeans were down 0.9 and 2.4 percent respectively but soybean meal was higher by 1.2 percent compared to last week. Prices were influenced by technical selling arising from geopolitical concerns and revised projections for crop sizes in Brazil and Argentine. Secondary factors included disruption in shipping in the Red Sea and Panama Canal, carryover from the 2023 U.S. crop, export orders and the predicted ending stocks of corn and soybeans for the 2024 crop. There was no apparent response to release of the April WASDE that retained projections for production and ending stocks from the March report although prior to release of planting intentions. Prices for corn and soybeans were down 0.9 and 2.4 percent respectively but soybean meal was higher by 1.2 percent compared to last week. Prices were influenced by technical selling arising from geopolitical concerns and revised projections for crop sizes in Brazil and Argentine. Secondary factors included disruption in shipping in the Red Sea and Panama Canal, carryover from the 2023 U.S. crop, export orders and the predicted ending stocks of corn and soybeans for the 2024 crop. There was no apparent response to release of the April WASDE that retained projections for production and ending stocks from the March report although prior to release of planting intentions.
At close of trading on April 18th the CME price for corn was down 0.9 percent compared to the previous week to 427 cents per bushel for May delivery. Corn price was influenced by higher ethanol demand and the proportionally high ending stock of corn from the 2023 crop. Export orders for the current market year have increased in response to lower prices. Volumes and prices are indirectly influenced by higher wheat prices, events in the Black and Red Seas. Orders by China resumed at the end of the 2022-2023 market-year and have extended through March despite a slightly higher Dollar Index offset by a low FOB prices although with increased ocean freight. Total exports for the current market year are 33.2 percent higher than for the corresponding week during the 2022-2023 year.
Soybeans traded at 1,162 cents per bushel for May 2024 delivery down 2.4 percent over the week. Lower prices were attributed to short covering, farm selling and availability from the 2024 Brazil and Argentine harvests. Total exports for the current market year are 18.2 percent lower than for the corresponding week in the 2022-2023 year.
Soybean meal traded at $338 per ton for May delivery, up 1.2 percent compared to $334 per ton for last week. Price was influenced by demand coupled with high crush volumes for consecutive months from December 2023 onwards albeit with lower volume in January due to the impact of cold weather. Price will fluctuate to reflect the CME price for soybeans and the demand for biodiesel despite the adverse financial situation in this sector. The market previously responded to the increased 2023 crop and higher stocks together with projections for 2024 unchanged from March in the April WASDE Report.
WTI was $1.32 (+1.5 percent) higher from last week to $87.24 on April 17th with moderate world demand in relation to supply. Price is higher partly due to disruption in shipping in the Red Sea, and turbulence in the Middle East but is countered by U.S. production attaining 12.9 million barrels per day in March with ample reserves. An upward trajectory in price may occur if production cuts by OPEC amounting to 2 million barrels per day and extended through June actually materialize. There was an upward move in price during the week ($86.43 to $89.47 range). Crude oil inventory in the U.S., other than the Strategic Reserve, was up 0.1 percent to 33.0 million barrels last week. High U.S. production is constraining domestic and international prices but the rise in energy cost during past weeks is reflected in ‘sticky’ inflation restraining the FOMC from lowering the benchmark interest rate.
Factors influencing commodity prices in either direction over the past four weeks included:-
- Weather conditions in areas of the World growing corn and oilseeds especially in Brazil and also Argentine with favorable rain recently under the influence of a strong La Nina The 2023 U.S. harvest was completed ahead of the corresponding weeks in 2022 with higher carryover (Downward pressure on prices). Planting has commenced for the “new” crop of 2024.
- Geopolitical considerations continue to move markets, especially in the Mideast. Ongoing attacks on Ukraine port facilities have impacted prices of wheat, corn, oilseeds and vegetable oils. Loaded bulk vessels are sailing from Black Sea and Danube River ports using the ‘Humanitarian Corridor” to various destinations. This route is operational despite threats by the Russian Federation to mine the entrance to ports and deployment of airborne missiles. Exports from Ukraine are approaching 1.5 million metric tons per week with a total of 26 million metric tons market year through February, down 11 percent from the equivalent period for 2022-2023 year. Grain production in Ukraine during the current year will be lower than 2022/2023 (Downward pressure on corn and wheat and an indirect effect on soybeans)
- Macroeconomic U.S. factors:-
- Most economists in academia and the private sector are confident of a “soft landing” for the economy following the release of revised Q4 2023 GDP and recent releases of economic parameters including the CPI and anticipated PPI and a decline in bond rates. Annual inflation as measured by CPI declined from 8.9 percent in June 2022 to 3.5 percent in March 2024. This is in part a response to a series of 11 FOMC rate raises that curbed inflation and cooled the labor market but without precipitating unemployment. There is evident stability in the bank sectors in both the U.S. and Europe. Large U.S. banks passed stringent mid-year “stress tests”. There is now concern over regional banks with exposure to commercial real estate. A rise in energy prices is contributing to persistence of inflation.
- The Federal Reserve held the benchmark interest rate steady at the monthly FOMC meeting on March 20th 2024, the fifth sequential pause. The Federal Reserve commentary indicated that the rate would be held at 5.25 percent until a pivot with possibly less than two reductions of 25 basis points each in 2024, after the September meeting at the earliest. Chairman Powell in Congressional testimony and documented in FOMC minutes has indicated that decisions would be based on data and demonstrable progress in reducing inflation towards an annual 2.0 percent target by mid-2025. Market optimism with projections of five reductions during 2024 was evidently premature.
- The March 28th Bureau of Economic Affairs announcement of the advanced estimate of Q4 GDP confirmed a value of 3.4 percent, slightly above the previous estimate of 3.2 percent. The rise was attributed to increased consumer and government sector spending and investment in inventory. Growth in GDP attained 2.5 percent in 2023 up from 1.9 percent in 2022.
- On March 29th the Bureau of Economic Analysis released the February Personal Consumption and Expenditure Price Index (excluding food and energy) that was up 0.3 percent from the previous month to 2.8 percent year-over-year. This was in line with estimates. Food prices increased 0.1 percent but energy was up 2.3 percent in March. The Headline PCE Index was up 2.5 percent year-over-year also corresponding to estimates. The price of goods increased 0.1 percent from February and was higher than services at 0.3 percent. Consumer spending was up 0.8 percent, above estimates and compared with 0.2 percent in January, impacted by weather. The headline PCE is closely followed by the Federal Reserve and confirms declining inflation.
- The April 10th Bureau of Labor Statistics release of the March 2024 CPI confirmed a 0.4 percent increase from February, and 0.1 percent above forecast. The annual increase of 3.5 percent was up from 3.2 percent in February and higher than the anticipated value. The increase in the core value (excluding food and energy) was 0.4 percent from February and 3.8 percent for the 12-month period, and estimates. Food at home was unchanged from the previous month. The category of meat, fish and poultry was up collectively by 0.9 percent with eggs up 4.6 percent from the previous month. Food away from home was up 0.3 percent from February. On an annual basis all food was up 2.2 percent with food at home up 1.2 percent and food away from home up 4.2 percent. Energy was up 1.1 percent together with natural gas (-3.2 percent) in March. The shelter category was up 0.4 percent for the month and 5.7 percent over the past year. The macro trend is inclining towards reduced inflation due to a fall in energy prices but this category has recently moved up, detracting from deflation. The CPI heavily influences FOMC rate decisions.
- The March Producer Price Index for Final Demand (PPI) released on April 11th was up by 0.2 percent from February compared to an expectation of 0.3 percent. The PPI was up 2.1 percent over the past 12-months. This is compared to a 6.4 percent increase in 2022. The core PPI value excluding volatile fuel and food, was up 0.2 percent for March and up 2.8 percent for the 12-month period. Food was up 0.8 percent compared to a 1.1 percent increase in February.
- A Federal Reserve release on March 15th confirmed that industrial production rose 0.1 percent in February. Production was adversely affected by inclement weather during January with plant closures. Capacity utilization was unchanged at 78.3 percent, 1.3 percent below the 1972-2020 average.
- The March 26th report on Durable Goods Ordered during February 2024 was higher by 1.4 percent to $278 Billion after two months of declines. Transportation and specifically aircraft orders were up 3.3 percent. Excluding the Transportation component, new orders increased by 0.5 percent in February compared to January impacted by inclement weather. Shipments of durable goods increased 1.2 percent following a fall of 0.8 percent in January 2024.
- The April 15th release of retail sales data showed a monthly rise of 0.7 percent in March. This value is compared to the revised 0.9 percent rise in February 2024, reflecting a rebound from depressed sales in January affected by harsh winter storms and a change in the basis of calculation. Retail sales in March 2024 were up 4.0 percent from the corresponding month in 2023. The Federal Reserve FOMC closely monitors retail sales as a measure of the trend in inflation.
- The April 1st release by the Institute for Supply Management (ISM®) documented the Manufacturing Index for March at 50.3 up from 47.8 in February and above the consensus of 48.4. New orders increased to 51.6 (49.2, February) and Production attained 54.6 (48.4, February).
- The April 1st release of the S&P Global U.S. Manufacturing PMI fell to 51.9 in March from a revised 52.2 in February but above the March 2023 value of 46.3.
- The Conference Board Consumer Confidence Index released on March 26th for February/March, rose to 104.7 points. This reading was almost unchanged from a revised 104.8 for the preceding four-week period. The Present Situation Index was up to 157.0 in March from 147.6 in February. The Expectations Index fell to 73.8 in March from 76.3 in February with values below 80.0 suggesting a future recession
- The March 15th University of Michigan Preliminary Index of Consumer Sentiment fell 1.5 points to 77.9 for April down from a revised final value of 79.4 in March. The Index was up from 63.7 in April 2023. Both the Current Economic Index (79.3 down from 82.5 but not statistically significant) and the Index of Consumer Expectations (74.7 down from 77.4 in March) denote a decline in consumer sentiment influenced by stable but high interest rates and inflation despite geopolitical concerns. Inflation expectations 12-months hence moved higher from 2.9 to 3.1 percent among those surveyed.
- Non-farm payrolls added 303,000 for March, as documented by the Bureau of Labor Statistics on April 5th. This was more than the anticipated 214,000, and compares to the revised February value of 270,000. The increase is attributed to workers in the health care and government sectors. The unemployment rate fell to 3.8 percent with 15 million unemployed. Real average weekly earnings for March showed a 0.3 percent increase over February. Average hours worked rose 0.1 percent to 34.4 per week in March. Labor participation increased fractionally from 62.5 percent in February to 62.7 percent in March. Wage rates increased 4.1 percent over 12-months, the lowest gain since June 2021. Wage rates are closely followed by the Federal Reserve FOMC.
- The Bureau of Labor Statistics Job Openings and Labor Survey report released on April 2nd estimated 8.8 million job openings at the end of February, down 100,000 (-0.1 percent) from January 2024 and consistent with estimates. The February job openings number was the lowest value in 34 months and compares with the March 2022 value of 12.2 million during COVID.
- The seasonally adjusted initial jobless claims figure of 212,000 released on April 18th was unchanged from from the revised seasonally adjusted value for the week ending April 11th but lower than the Reuter’s estimate of 215,000. The four-week moving average declined to 214,500 The Bureau of Labor Statistics estimated 1.81 million continuing claims for the week ending April 6th up 2,000 from the previous week. There is evidence from data over the past three months that the labor market is cooling despite sporadic weekly fluctuation in new claims.
- The April 5th Bureau of Labor Statistics report recorded a 0.7 percent increase in non-Farm Productivity for 2023. Output increased by 2.6 percent with a 1.9 percent increase in inputs of labor and capital. Hours Worked was up by 1.3 percent in 2023
- The ADP® reported on April 3rd that private payrolls increased by 184,000 in March, up 29,000 from the revised 155,000 in January and compared to the Bloomberg estimate of 150,000 jobs. The increase in employment was mostly in the construction, financial services and manufacturing sectors. Annual pay was up 5.1 percent year-over-year unchanged from February. The increase will not directly influence the probability of short-term future changes in interest rate since the ADP® is regarded by the FOMC as an unreliable statistic
|
States Respond to Outbreaks of Bovine Influenza-H5N1
|
|
 Seventeen states have placed restrictions on introduction of cattle from any of the eight states reporting bovine influenza-H5N1. Effective April 12th diagnosed cases (27) include Texas, Kansas, New Mexico, Idaho, South Dakota, North Carolina, Michigan, and Ohio. Seventeen states have placed restrictions on introduction of cattle from any of the eight states reporting bovine influenza-H5N1. Effective April 12th diagnosed cases (27) include Texas, Kansas, New Mexico, Idaho, South Dakota, North Carolina, Michigan, and Ohio.
Both the U.S. Centers for Disease Control and Prevention and the World Health Organization have issued recommendations based on application of elementary biosecurity to prevent spread and to limit extension to human contacts of cattle. The use of personal protective equipment is advised.
Recommendations by the WHO include enhanced surveillance with reporting of cases especially in unusual hosts through the World Animal Health Information System. Above all,  the World Organization of Animal Health (WOAH) has counseled against implementing “unjustified trade restrictions and import bans” and has advocated adherence to WOAH international standards.” the World Organization of Animal Health (WOAH) has counseled against implementing “unjustified trade restrictions and import bans” and has advocated adherence to WOAH international standards.”
The American Association of Bovine Practitioners has designated the infection as “Bovine Influenza-A” and has established a working group to cooperate with federal and state agencies and to develop biosecurity protocols.
|
CDC Issues Health Alert over Bovine Influenza-H5N1
|
|
 The Centers for Disease Control and Prevention (CDC) issued a health alert on Friday April 5th following the single case of human influenza attributed to H5N1 virus, designated strain 3:13 contracted from dairy cows infected with bovine influenza-H5N1. The health alert was issued to advise physicians and public health workers of the possibility of human influenza-H5N1. The Centers for Disease Control and Prevention (CDC) issued a health alert on Friday April 5th following the single case of human influenza attributed to H5N1 virus, designated strain 3:13 contracted from dairy cows infected with bovine influenza-H5N1. The health alert was issued to advise physicians and public health workers of the possibility of human influenza-H5N1.
The CDC also reinforced recommendations to use personal protective equipment for workers at risk. The alert also encouraged the monitoring of agricultural workers and those exposed to sick or dead wild and domesticated birds that may have been infected with H5N1 virus.
|
Need to Reassure Consumers over Egg and Milk Safety Over Emerging H5N1 Infections
|
|
 Both mainstream outlets and social media are reporting widely on the emergence of bovine influenza-H5N1 and recent outbreaks of HPAI in egg operations. Both mainstream outlets and social media are reporting widely on the emergence of bovine influenza-H5N1 and recent outbreaks of HPAI in egg operations.
- The dairy industry is confirming safety by stating that milk from affected cows does not enter the supply stream and that in any event pasteurization inactivates influenza virus.
- The situation for eggs is similar. Infection of a flock results in a precipitous drop in egg production and a rapid rise in mortality resulting in rapid diagnosis and withholding of eggs from the market. Cooking eggs will destroy avian influenza virus that does not in any event appear transmissible to consumers through food.
 Dr. Barbara Kowalcyk director of the Center for Food Safety and Nutrition Security at George Washington University correctly stated, “Eggs that are handled properly and cooked thoroughly are safe to eat.” Dr. Barbara Kowalcyk director of the Center for Food Safety and Nutrition Security at George Washington University correctly stated, “Eggs that are handled properly and cooked thoroughly are safe to eat.”
|
USDA Now Involved in Reviewing Foreign Purchase of Agricultural Land
|
|
 Provisions to prevent “hostile” nations form acquiring agricultural land in the U.S. are incorporated in the USDA appropriations for fiscal year 2024. The Secretary of Agriculture will now be a member of the Committee on Foreign Investment in the United States and will participate in implementing the Agricultural Foreign Investment Disclosure Act of 1978. An allotment of $2 million was assigned to the USDA to fulfill this obligation. Provisions to prevent “hostile” nations form acquiring agricultural land in the U.S. are incorporated in the USDA appropriations for fiscal year 2024. The Secretary of Agriculture will now be a member of the Committee on Foreign Investment in the United States and will participate in implementing the Agricultural Foreign Investment Disclosure Act of 1978. An allotment of $2 million was assigned to the USDA to fulfill this obligation.
The strengthening of oversight of purchases of agricultural land by foreign nations is the result of a U.S. Government Accountability Office review and report conducted in January 2024 that criticized the USDA for collecting data that was not adequately shared with the CFIUS. Five recommendations made by the GAO were accepted by USDA and will be implemented.
In 2021, EGG-NEWS reported on the intended purchase of a specific tract of land by China ostensibly to erect a corn milling facility that was initially welcomed by the local community. This intended transaction was ignored by the CFIUS, notwithstanding the fact that the intended purchase was located in close proximity to the Grand Forks Air Force Base. The U.S. Air Force vigorously opposed the purchase and the resulting publicity resulted in termination of the intended project.
At the end of 2022 close to 43 million acres or 3.4 percent of U.S. agricultural acreage was owned by foreign entities. Canadian companies owned 32 percent of this amount mostly as forests. Agricultural tracts were owned by the Netherlands (6 percent); Italy, Germany and the U.K. (5 percent each) Japan, (1.5 percent) and China, (1 percent) mostly through acquisition of Smithfield Foods. Concern has been expressed over potential purchases by unfriendly nations including the Peoples Republic of China, Iran, the Russian Federation and more unlikely North Korea and Venezuela.
|
Nestle Purina PetCare Opens Production Facility in Eden, NC.
|
|
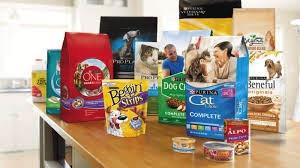 Nestle Purina PetCare has inaugurated a plant to produce pet food in Eden, NC. The project involved conversion of an existing brewery at a cost $450 million over three years. Nestle Purina PetCare has inaugurated a plant to produce pet food in Eden, NC. The project involved conversion of an existing brewery at a cost $450 million over three years.

Will Steiner manager of the new facility stated, “We have been looking forward to this day for a very long time and are so grateful for the contributions of so many incredible associates who have been working hard to bring this factory to life.” He continued, “What is most exciting is we can now really get to work and produce many of our brands that pets love and owners trust.”
The inaugural event was celebrated with a $30,000 donation to the Rockingham Community College to support a center for workforce development and $7,000 to the Dan River Basin Association that encourages pets and people to explore nature together. Additional donations were made to the Rockingham County Veteran’s Park and the County animal shelter and the Canine Officer for the Eden police force.
|
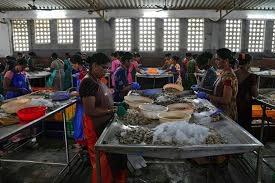
Shrimp from India Contravenes Health and Labor Standards
|
|
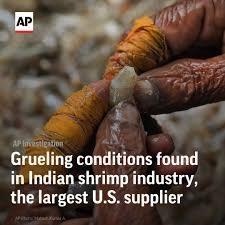 NBC News has publicized the allegations of Joshua Farinella previously employed in the shrimp industry in India concerning injudicious use of antibiotics and coercive labor practices by exporters of shrimp from India. Farinella has elicited interest in Congress regarding unfair competition by shrimp producers in Asia and specifically India. NBC News has publicized the allegations of Joshua Farinella previously employed in the shrimp industry in India concerning injudicious use of antibiotics and coercive labor practices by exporters of shrimp from India. Farinella has elicited interest in Congress regarding unfair competition by shrimp producers in Asia and specifically India.

Representative Mary Peltola (D-AK) and Representative Garret Graves (R-LA) have addressed a letter to the White House alleging, “These foreign producers deliberately use government subsidies and shortcuts- like packing the supply with banned antibiotics or using feed obtained through illegal, unreported and unregulated fishing practices to undercut domestic shrimp suppliers and flood the American market with cheap and unsafe shrimp.” Currently, Congress is reviewing H.R. 4547, the Law Ensuring Safe Shrimp (LESS) Act that will intensify action by the FDA to monitor imported shrimp. This Agency inspected only one percent of shrimp imports for the presence of antibiotics in 2023. In comparison, the E.U. Food Safety Agency recognizes the need to inspect half of all imports.
Allegations by Farinella concerning the exploitation of workers were confirmed independently by the Corporate Accountability Lab. Practices include forced labor, debt bondage and employing child labor.
Representatives of companies importing and selling shrimp from India maintain that their corporate policies prohibit forced labor or unsafe working conditions and they have committed to respond to reports of unsafe product and violations of international labor standards.
|
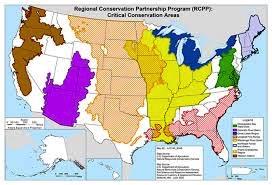
$1.5 Billion Available for Conservation and Climate Related Projects
|
|
 On April 3rd, Tom Vilsack, secretary of agriculture announced that $1.5 billion will be available in fiscal 2024 for conservation and climate-related projects. Funding available through the Regional Conservation Partnership Program is intended to expand conservation of ranch land and forests with the ultimate intent of modulating climate change. In an address to producers in Minnesota, Secretary Vilsack stated, “We had unprecedented demand for the Regional Conservation Partnership Program last year showing the robust interest in conservation from farmers and ranchers.” He added, “We are looking forward to seeing what the more streamlined and customer-oriented Regional Conservation Partnership Program can do to get more conservation on the ground in the coming months and years.” On April 3rd, Tom Vilsack, secretary of agriculture announced that $1.5 billion will be available in fiscal 2024 for conservation and climate-related projects. Funding available through the Regional Conservation Partnership Program is intended to expand conservation of ranch land and forests with the ultimate intent of modulating climate change. In an address to producers in Minnesota, Secretary Vilsack stated, “We had unprecedented demand for the Regional Conservation Partnership Program last year showing the robust interest in conservation from farmers and ranchers.” He added, “We are looking forward to seeing what the more streamlined and customer-oriented Regional Conservation Partnership Program can do to get more conservation on the ground in the coming months and years.”

Priorities for 2024 include “climate-smart agriculture”, conservation and environmental justice, all priorities of the current Administration and reflecting an emphasis on disadvantage and minority communities.
$1.5 billion is a large sum to be distributed in small amounts to a large number of recipients. One is reminded of the comment by the late Hubert Humphrey that “a billion here and a billion there and it soon adds up to real money.” It is probably incidental that the USDA announcement was made in the home state of the late Senator and Vice President.
Given the nebulous objectives associated with $1.5 billion in grants, taxpayers are entitled to an accounting with quantitative evaluation of returns. Is this too much to ask? Is this expenditure supposedly for climate change actually an exercise in altruistic social engineering?
|
SEC to Place Climate Disclosure Rules on Hold Following Legal Challenges
|
|
  The Securities and Exchange Commission (SEC) will place on hold the imposition of proposed climate disclosure rules. Opponents claim that the requirements exceed the authority of the Agency with respect to disclosure of Scope One and Scope Two emissions. The SEC originally required disclosure of Scope Three emissions for which reporting would be extremely difficult if not impossible for many companies including food producers. The Securities and Exchange Commission (SEC) will place on hold the imposition of proposed climate disclosure rules. Opponents claim that the requirements exceed the authority of the Agency with respect to disclosure of Scope One and Scope Two emissions. The SEC originally required disclosure of Scope Three emissions for which reporting would be extremely difficult if not impossible for many companies including food producers.
|
U.S. Greenhouse Gas Emissions Quantified
|
|
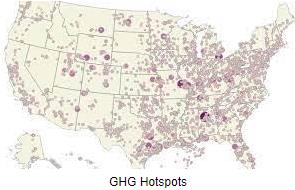 The Environmental Protection Agency prepares an annual inventory of U.S. greenhouse gas emissions that is submitted to the United Nations under the Framework Convention on Climate Change and the Paris Agreement. The Environmental Protection Agency prepares an annual inventory of U.S. greenhouse gas emissions that is submitted to the United Nations under the Framework Convention on Climate Change and the Paris Agreement.
In 2022, net U.S. greenhouse gas emissions totaled 5,489 million metric tons of carbon dioxide equivalents after taking into account sequestration by the land sector. In 2022, emissions increased by one percent mainly from combustion of fossil fuel. This was a result of an increase in economic activity after relaxation of COVID restrictions. Sources of greenhouse gas emissions in 2022 comprised 80 percent carbon dioxide, 11 percent methane, 6 percent nitrous oxide and the remaining 3 percent from a mixture of compounds.
In evaluating sources of greenhouse gas emission by economic sector, agriculture represented 10 percent, industry 30 percent, residential and commercial emitters 31 percent and transportation 30 percent.
Based on the low contribution of the agricultural sector, activists condemning livestock production appear to have missed their target. Perhaps staying up at night while running an air conditioner and writing posts for social media about the evils of meat and poultry production contributed to the residential contribution.
|
Conagra Brands Releases Q3 FY 2024 Financial Results
|
|
 In an April 4th 2024 release, Conagra Brands (CAG) posted financial results for the third quarter of Fiscal 2024 ending February 23rd 2024. The Company can be regarded as representative of the manufacturing and packaged food sector with competitors including Post Holdings, Campbell Soup Company and Kraft-Heinz, all currently under pressure to reduce prices to the major food service providers and supermarket chains. In an inflationary environment consumers are turning to less expensive private brands although the trend to eat-at-home may benefit Conagra Brands and competitors. In an April 4th 2024 release, Conagra Brands (CAG) posted financial results for the third quarter of Fiscal 2024 ending February 23rd 2024. The Company can be regarded as representative of the manufacturing and packaged food sector with competitors including Post Holdings, Campbell Soup Company and Kraft-Heinz, all currently under pressure to reduce prices to the major food service providers and supermarket chains. In an inflationary environment consumers are turning to less expensive private brands although the trend to eat-at-home may benefit Conagra Brands and competitors.
For the third quarter of FY 2024, net income was $308.6 million on net revenue of $3,033 million with a diluted EPS of $0.64. Comparable figures for the third quarter of FY 2023 ending February 26th 2023 were net income of $342.2 million on net revenue of $3,087 million with a diluted EPS of $0.72
The release included results for the four operating segments:-
- Foodservice: Operating profit of $35 million down 48.7 percent from Q3 2023, on revenue of $273 million
- Refrigerated and Frozen: Operating profit of $202 million, down 24 percent, on revenue of $1,200 million
- International: Operating profit of $42 million, up 14 percent on revenue of $272 million
- Groceries and Snacks: Operating profit of $299 million, up 16 percent on revenue of $1,300 million
 For the third quarter of FY 2024 (with the values for the corresponding quarter of FY 2023 in parentheses) Conagra achieved a gross margin of 28.3 percent (27.2) and an operating margin of 15.6 percent (15.9). Revenue was down 1.8 percent. For the third quarter of FY 2024 (with the values for the corresponding quarter of FY 2023 in parentheses) Conagra achieved a gross margin of 28.3 percent (27.2) and an operating margin of 15.6 percent (15.9). Revenue was down 1.8 percent.
Guidance for FY 2024 included a net sales decline of 1 to 2 percent; an adjusted increase in operating margin of 15.8 percent and an EPS of between $2.60 and $2.65. Capital expenditure was projected at $425 million.
Conagra Brands listed assets of $21,919 million, including a disproportionate $14,261 million as goodwill and intangibles, against long-term debt and other obligations of $9,221 million. The Company had an intraday market capitalization of $14,230 million on April 16th. CAG trades with a forward P/E of 10.9 and has ranged over a 52-week period from $25.16 to $38.75 with a 50-day moving average of $28.69. Twelve-month trailing operating and profit margins were 17.7 percent and 7.9 percent respectively. The Company generated a twelve-month trailing return of 5.3 percent on assets and 10.5 percent on equity.
|
Participation in School Feeding Relates to Financial Support
|
|
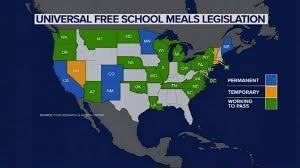 Participation in school feeding programs has declined following the end of federal COVID- period support. A recent report demonstrated that during the 2022-23 school year 28.1 million students participated in school lunch programs. This was six percent less than the number of students participating during the previous academic year. Breakfast participation declined by 7.7 percent with a total of 14.3 million students served. Participation in school feeding programs has declined following the end of federal COVID- period support. A recent report demonstrated that during the 2022-23 school year 28.1 million students participated in school lunch programs. This was six percent less than the number of students participating during the previous academic year. Breakfast participation declined by 7.7 percent with a total of 14.3 million students served.

States that supported school feeding after expiration of federal support noted an increase in both breakfast and lunch servings. An increase in student participation was directly attributed to the Community Eligibility Provision comprising a federal program that allows students to be fed irrespective of income status to avoid “food shaming”.
Investment in school feeding improves attendance and contributes to scholastic progress. Accordingly, many states are expanding access to free school meals. Currently there is a patchwork of reduced-price meals for selected students with an emphasis on elementary grades.
 The report called for uniform federal legislation to allow all schools to feed all students free of charge. The report called for uniform federal legislation to allow all schools to feed all students free of charge.
|
Quaker Oats to Permanently Close Danville, IL. Plant
|
|
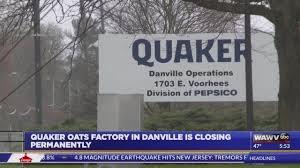 Following a recall of products in December 2023, the Quaker Oats Company a subsidiary of PepsiCo will permanently close the 55-year-old plant and transfer production to other facilities. The recall was due to contamination of granola bars and cereals with Salmonella. A review of the plant indicated the need for extensive refurbishment and installation of new equipment that would have required a prolonged down time. Following a recall of products in December 2023, the Quaker Oats Company a subsidiary of PepsiCo will permanently close the 55-year-old plant and transfer production to other facilities. The recall was due to contamination of granola bars and cereals with Salmonella. A review of the plant indicated the need for extensive refurbishment and installation of new equipment that would have required a prolonged down time.
Brand image and reputation were considerations in the decision to close the plant given the potential for a reoccurrence of infection despite decontamination and upgrading.
 Subscribers are referred to an extensive recall of infant formula from 83 nations in 2017. The product was contaminated with S. Agona resulting in multiple cases and fatalities. The plant involved was located in Craon, France, and was operated by Lactalis, a multinational dairy producer. The plant was out of operation for over a year during cleaning and upgrading of food safety equipment and installations. Subscribers are referred to an extensive recall of infant formula from 83 nations in 2017. The product was contaminated with S. Agona resulting in multiple cases and fatalities. The plant involved was located in Craon, France, and was operated by Lactalis, a multinational dairy producer. The plant was out of operation for over a year during cleaning and upgrading of food safety equipment and installations.
|
Target Introduces TruScan at Self-Checkout
|
|
 Faced with deliberate theft and inadvertent errors in scanning, Target Corp has introduced TruScan Technology that integrates overhead cameras with check-out scanners. If an item is not scanned, the customer receives an audio and visual cue, and a store employee is alerted. The technology has been tested in a number of stores with success. At the present time, self check-out is limited to ten items and the Company is adding more conventional check-out lanes manned by clerks. Faced with deliberate theft and inadvertent errors in scanning, Target Corp has introduced TruScan Technology that integrates overhead cameras with check-out scanners. If an item is not scanned, the customer receives an audio and visual cue, and a store employee is alerted. The technology has been tested in a number of stores with success. At the present time, self check-out is limited to ten items and the Company is adding more conventional check-out lanes manned by clerks.

Other supermarket chains, including Harris-Teeter a Kroger banner, are installing cameras above self-checkout stations. The extent of their integration with the scanners is not known.
|
USPOULTRY Awards Research Grants
|
|
 The USPOULTRY Foundation has approved research grants that will benefit the egg production sector of the U.S. poultry industry. Funding was approved by the Board of Directors based on recommendations by the Foundation Research Advisory Committee. Grants for projects included: The USPOULTRY Foundation has approved research grants that will benefit the egg production sector of the U.S. poultry industry. Funding was approved by the Board of Directors based on recommendations by the Foundation Research Advisory Committee. Grants for projects included:
- Role of phytase dosage and reduced dietary mineral levels in pullet performance. Mississippi State University
- Poultry house mass depopulation calculator. North Carolina State University
- Advancing infectious coryza diagnosis and control. Iowa State University
 Since inception of the Comprehensive Research Program USPOULTRY has invested more than $36 million in research grants to fifty universities and federal and state institutions Since inception of the Comprehensive Research Program USPOULTRY has invested more than $36 million in research grants to fifty universities and federal and state institutions
|
Costco Reports on March Sales
|
|
 For the five weeks ended April 7th, Costco Wholesale Corporation (COST) posted net sales of $23,480 million for the retail month of March compared to $21,460 million for the corresponding five-week period in 2023. Comparable sales, excluding foreign exchange and gasoline, the total company increased same-store sales by 7.5 percent with the U.S. at 7.4 percent, Canada at 7.3 percent and Other International at 8.4 percent. E-commerce increased by 28.0 percent. The retail month of March was impacted by the timing of Easter and accounted for approximately 0.5 percent in For the five weeks ended April 7th, Costco Wholesale Corporation (COST) posted net sales of $23,480 million for the retail month of March compared to $21,460 million for the corresponding five-week period in 2023. Comparable sales, excluding foreign exchange and gasoline, the total company increased same-store sales by 7.5 percent with the U.S. at 7.4 percent, Canada at 7.3 percent and Other International at 8.4 percent. E-commerce increased by 28.0 percent. The retail month of March was impacted by the timing of Easter and accounted for approximately 0.5 percent in comparable sales. comparable sales.
Costco operates 876 warehouses worldwide including 604 in the U.S. and Puerto Rico, 108 in Canada, 40 in Mexico, 33 in Japan, 29 in the U.K. and 62 in Asia, Europe and Australia.
|
Iowa House Passes Legislation on Meat Labeling and Egg Substitutes
|
|
 Previously the Iowa Senate passed File 2391 establishing labeling restrictions for non-animal derived substitute meat products. Subsequently the House passed the Bill adding an amendment prohibiting purchase of egg substitutes under food assistance programs. Opposition to the amendment in the House was based on depriving recipients of food assistance (SNAP and WIC) from choice in purchasing “fabricated egg products”. Previously the Iowa Senate passed File 2391 establishing labeling restrictions for non-animal derived substitute meat products. Subsequently the House passed the Bill adding an amendment prohibiting purchase of egg substitutes under food assistance programs. Opposition to the amendment in the House was based on depriving recipients of food assistance (SNAP and WIC) from choice in purchasing “fabricated egg products”.
 Synthetic plant-based alternatives to real eggs are more expensive and less nutritious than the product they intend to displace. The intent of legislators in the state with the most hens is obviously well founded. The problem arises with individuals who are allergic to eggs and use egg substitutes. As a solution the Iowa Department of Health and Human Services will seek waivers for those with confirmed allergies to purchase alternatives to real eggs. Synthetic plant-based alternatives to real eggs are more expensive and less nutritious than the product they intend to displace. The intent of legislators in the state with the most hens is obviously well founded. The problem arises with individuals who are allergic to eggs and use egg substitutes. As a solution the Iowa Department of Health and Human Services will seek waivers for those with confirmed allergies to purchase alternatives to real eggs.
|
EPA Introduces PFAS Drinking Water Standards
|
|
 After prolonged and detailed review, the Environmental Protection Agency (EPA) has published legally enforceable drinking water standards for per-and-polyfluoroalkyl (PFAS) compounds colloquially referred to as “forever chemicals”. It is estimated that between 6 and 10 percent of 65,000 public drinking water systems will be required to reduce levels of contamination that exceed the published standards. After prolonged and detailed review, the Environmental Protection Agency (EPA) has published legally enforceable drinking water standards for per-and-polyfluoroalkyl (PFAS) compounds colloquially referred to as “forever chemicals”. It is estimated that between 6 and 10 percent of 65,000 public drinking water systems will be required to reduce levels of contamination that exceed the published standards.
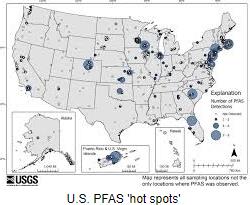
The EPA designated six PFAS compounds as “genX chemicals” with maximum contaminant levels established for individual compounds and their combinations.
Water supply systems will have three years to complete initial monitoring and will then be required to disclose levels of PFAS compounds to consumers. Removal of compounds will be mandated over a five-year period. Current technology capable of removing PFAS compounds from drinking water include filtration through granular activated carbon, reverse osmosis and ion exchange.

In addition to providing technical assistance to water supply systems, $1 billion will be made available to implement testing and treatment with funding derived from the Bipartisan Infrastructure Law.
|
Responsibility for Food Inflation?
|
|
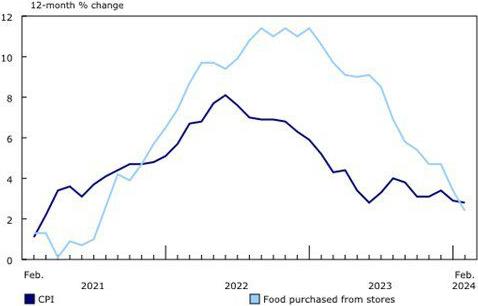
 The weekly Economic, Energy and Commodity Report in EGG-NEWS details weekly and monthly data released by federal agencies relating to the U.S. economy. Despite the reduction in inflation and the evident deflation in food prices, consumer perceptions erroneously consider what they purchase at the supermarket as a major factor in increasing the cost of living. During the past month, energy costs that have previously contributed to deflation have reversed course with obvious increases at the gas pump. The weekly Economic, Energy and Commodity Report in EGG-NEWS details weekly and monthly data released by federal agencies relating to the U.S. economy. Despite the reduction in inflation and the evident deflation in food prices, consumer perceptions erroneously consider what they purchase at the supermarket as a major factor in increasing the cost of living. During the past month, energy costs that have previously contributed to deflation have reversed course with obvious increases at the gas pump.
Consumers blame “government policies” for high prices of groceries. Conflict in Eastern Europe and the Middle East are contributing to disruption of supply chains and escalation in prices of food items. Consumers have the perception that retail chains are responsible for higher food prices. A survey showed that a sample of shoppers estimated net profits of chains to be in the region of thirty percent whereas, in fact, they range from one to five percent. The accusation of price gouging has become a political issue with unsubstantiated rhetoric by senior officials supported by injudicious statements by the Federal Trade Commission.
 Discontent among consumers will be a major issue in the November General Election. The concurrent concern over the proposed Kroger-Albertsons merger is now playing out against the backdrop of politics. The transaction has now devolved into litigation with individual states and the Federal government opposed to the merger. Discontent among consumers will be a major issue in the November General Election. The concurrent concern over the proposed Kroger-Albertsons merger is now playing out against the backdrop of politics. The transaction has now devolved into litigation with individual states and the Federal government opposed to the merger.
Industry associations representing sectors of the poultry industry should be more aggressive in presenting economic realities to dispel false notions of manipulation of prices and unethical business practices. At the end of the day, consumers do not regard farmers as being responsible for price escalation. This is one comforting consideration in a complex issue with a lot of blame to be assigned.
|
Ralph Rindler UB Egg Person of the Year
|
|
 Ralph Rindler of Prairie Star Farms was honored as the 2023 Egg Person of the Year at the annual Urner Barry Executive Conference in Las Vegas on Monday April 15th. Ralph Rindler of Prairie Star Farms was honored as the 2023 Egg Person of the Year at the annual Urner Barry Executive Conference in Las Vegas on Monday April 15th.

In presenting the award Randy Pesciotta Egg Reporter for Urner Barry noted “The desire and passion for growth expressed by Ralph has always utilized strong family relationships helping others to become successful along the way,” Randy added “Prairie Star Farms will always have that family feel producing quality eggs with a strong commitment to trusting relationships with everyone they do business with, thanks to the roots that Ralph has established.”
EGG-NEWS extends congratulations to Ralph and Janet on receiving this prestigious award recognizing a career of accomplishment.
|
Regulatory Authorities Prosecuting “Greenwashing”
|
|
 Regulatory authorities on both sides of the Atlantic are evaluating claims of environmental concern by livestock producers. Reports were posted on EGG-NEWS regarding a stay on reporting greenhouse gas emissions by public companies but unrealistic and unsubstantiated claims are receiving attention. In addition to regulatory action, environmental activist organizations are petitioning federal agencies and initiating lawsuits challenging environmental claims such as those advertised by JBS SA. Regulatory authorities on both sides of the Atlantic are evaluating claims of environmental concern by livestock producers. Reports were posted on EGG-NEWS regarding a stay on reporting greenhouse gas emissions by public companies but unrealistic and unsubstantiated claims are receiving attention. In addition to regulatory action, environmental activist organizations are petitioning federal agencies and initiating lawsuits challenging environmental claims such as those advertised by JBS SA.

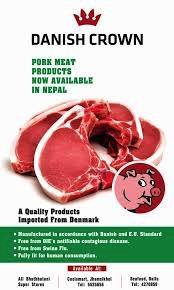 During March 2024, major hog producer Danish Crown admitted to a violation of that nation’s Marketing Act. Their campaign claimed, “Danish pork is more climate-friendly than you think.” When introduced in 2021 the claim was opposed by activists and vegan associations in Denmark and resulted in a cancellation of the campaign. During March 2024, major hog producer Danish Crown admitted to a violation of that nation’s Marketing Act. Their campaign claimed, “Danish pork is more climate-friendly than you think.” When introduced in 2021 the claim was opposed by activists and vegan associations in Denmark and resulted in a cancellation of the campaign.
In a statement following their admission of responsibility, Danish Crown stated, “We now want to look ahead and instead use our efforts on the transition to less climate-damaging production.” The statement added, “We will communicate our climate measures within the framework of the Western High Court decision as well as this affirmative response to the plaintiffs’ claims.”
|
The Dairy Industry Discovers Biosecurity-Too Little, Too Late?
|
|
 Since late March, 28 cases of bovine influenza-H5N1 (and counting!) have been diagnosed in eight states. To date this has not impacted either total milk supply or prices of fluid milk, based on the negligible reduction in supply. Since late March, 28 cases of bovine influenza-H5N1 (and counting!) have been diagnosed in eight states. To date this has not impacted either total milk supply or prices of fluid milk, based on the negligible reduction in supply.
Without a preliminary epidemiologic study, operators of dairy herds have initiated procedures to limit introduction of infection. Initial observations suggest that H5N1 influenza virus is introduced into the vicinity of herds by domestic wild birds susceptible to the virus including grackles and pigeons as reported for the index farm in Texas.
In the absence of structural and operational biosecurity as used in the poultry industry, dairy herds appear vulnerable. Workers are evidently tracking virus into the vicinity of farms and congregation of animals in close proximity during milking appears to favor animal-to-animal infection. Milking machines may be implicated in direct transmission of virus among cows even to the level of a mammary quarter. The emergence of a single case of human influenza H5N1 in a dairy-herd worker highlights the need for personnel protective equipment.
 Initial evidence suggests that movement of live animals among states is responsible for wide geographic spread of bovine influenza-H5N1. Accordingly, as many as 17 unaffected states with dairy production have imposed restrictions on movement of live animals from affected areas. Ultimately demonstration of freedom from infection by PCR surveillance will be necessary to allow interstate movement. Initial evidence suggests that movement of live animals among states is responsible for wide geographic spread of bovine influenza-H5N1. Accordingly, as many as 17 unaffected states with dairy production have imposed restrictions on movement of live animals from affected areas. Ultimately demonstration of freedom from infection by PCR surveillance will be necessary to allow interstate movement.
At this time, risk to human populations appears exceptionally low given the fact that only one mild human case has been diagnosed, against the reality of thousands of person-day contacts on affected farms. Milk from infected cows has apparently not entered commercial supply. Pasteurization effectively destroys influenza virus.
Studies are in progress to characterize the H5N1 strain responsible for bovine influenza-H5N1. Mutations have occurred in avian strains of the virus allowing infection of carnivorous animals coming into contact with dead birds. A disquieting series of infections among marine mammals in the U.S. northeast and along the Pacific coast of South America and an outbreak in farmed mink in Spain confirm that mammal-to-mammal infection occurs.
National and international human and veterinary health agencies are monitoring the presence of infection in livestock and assessing the risk for human infection. The World Health Organization is relying on regional influenza reference laboratories to detect the emergence of human infection and the Agency has established contingency plans for a possible pandemic occurrence.
The World Organization of Animal Health is recommending the adoption of preemptive immunization as an adjunct to biosecurity to suppress outbreaks. It is self-evident that concentration of large numbers of commercial poultry in endemic areas represents the potential for mutations and recombinant events, ultimately representing a danger for human populations. This would in large measure be reduced if large egg-production complexes in high-risk areas were to be vaccinated.
|
CDC Reports on Salmonellosis Acquired from Backyard Chickens
|
|
 A recent report in the CDC house journal MMWR* documented 1,072 cases of salmonellosis associated with backyard poultry resulting in 247 hospitalizations. Serotypes included S. Braenderup, Enteritidis, Indiana, Infantis, and Typhimurium with multiple states involved. The report also included documentation of S. Thompson in a breastfed neonate who contracted infection within days of returning to a home with his mother after delivery. It is presumed that infection was acquired from environmental contamination or from a shedder of the pathogen within the household. Based on whole genome sequencing, identical isolates were recovered from the infant, the chickens and their environment. A recent report in the CDC house journal MMWR* documented 1,072 cases of salmonellosis associated with backyard poultry resulting in 247 hospitalizations. Serotypes included S. Braenderup, Enteritidis, Indiana, Infantis, and Typhimurium with multiple states involved. The report also included documentation of S. Thompson in a breastfed neonate who contracted infection within days of returning to a home with his mother after delivery. It is presumed that infection was acquired from environmental contamination or from a shedder of the pathogen within the household. Based on whole genome sequencing, identical isolates were recovered from the infant, the chickens and their environment.
The report cautioned personal biosecurity following contact with backyard chickens. Taking into account the incidence rate of chicken acquired salmonellosis and the 24 percent hospitalization rate, it is questioned whether the benefits of maintaining backyard poultry are commensurate with the risk if not inevitability of infection and its consequences.
* Ladd-Wilson SG, et al. Neonatal Salmonellosis Associated with Backyard Poultry. MMWR 73:321-322. (2024)
|

 |
|
Commentary
|
|
|